Tag: networking

  • Patronus: I switched on the guest network and tried to get out of it

    Patronus: I switched on the guest network and tried to get out of it

    Full disclosure: I make Patronus, a router and firewall OS built on Gentoo. The guest network page is the newest thing I’ve added to it. It went into main on November 17 and isn’t in a tagged release yet.

    Every router says guests can’t reach your LAN. I wanted to check that claim, so on November 22 I switched the guest network on in a lab and tried to reach the NAS, the router’s admin page, the modem and the other guest.

    The lab

    This was a lab, not my house. One container with a handful of network namespaces: the router (the real patronus-web plus the apply step, built from main at commit 02e0a2c7, 5 minutes 11 seconds cold in a capped container), one LAN device, two “visitor” devices on two spare router ports, a fake ISP and a fake internet. The NAS is a tiny web server on the LAN that answers “192.168.50.13 sees 192.168.50.10”. The ISP modem’s admin page is another one at 10.77.7.7, behind the WAN. Everything is curl and a DHCP client. I drove the admin page with a real browser, from the LAN device’s namespace.

    Things that are fake or missing. There is no radio, so this is the wired half only: visitors are plugged into ports and the Wi-Fi switch stayed off. The visitors run busybox’s udhcpc, not a phone. The lab router has no resolver of its own, so I filled in the “Router DNS forwards to” box with the fake internet’s DNS server. The page still carries a “This router has not been set up yet” banner because I never ran the setup wizard in this lab.

    Turning it on

    The guest network is off until you switch it on, and everything lives on one page: /svc/guest. It’s one long form. I ticked the box, set the VLAN id to 0 (no VLAN, use ports only), listed the two spare ports, left the address at its default of 192.168.30.1/24, and set a per-guest download cap of 4000 kbit/s.
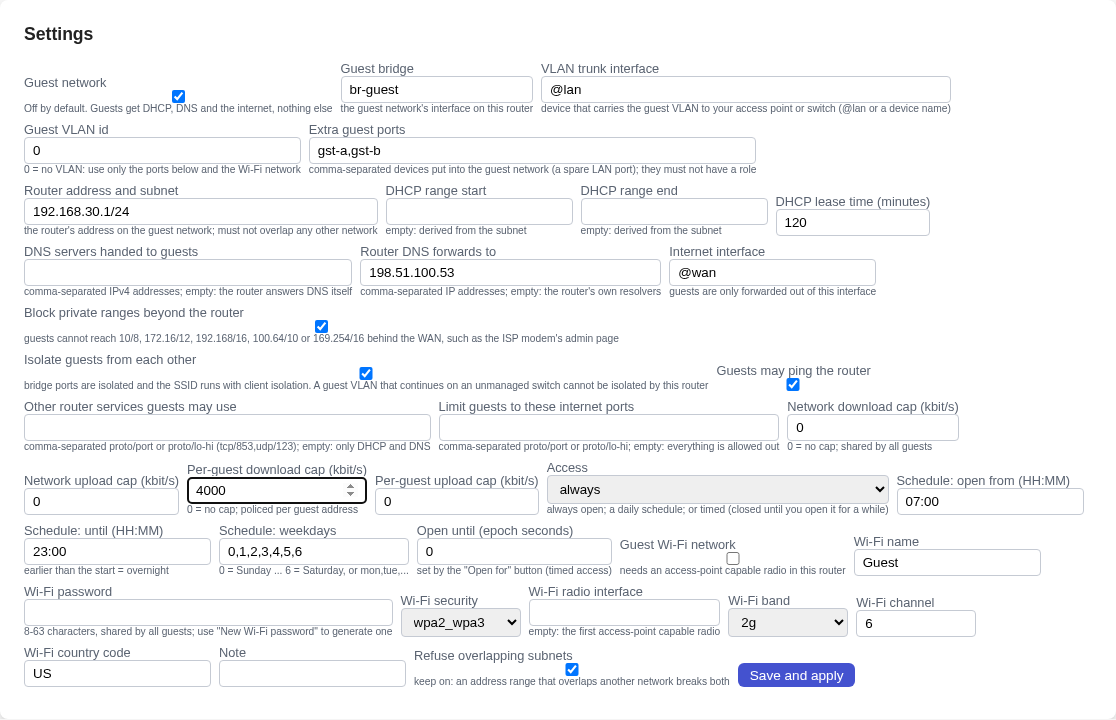
    The guest network settings form with the network switched on, extra ports gst-a and gst-b, address 192.168.30.1/24 and a per-guest download cap of 4000
    The settings form as I filled it in. The DNS forwarder box is only filled because my lab router has no resolver.

    Before the real save I tried to break it. I typed the LAN’s own subnet, 192.168.50.5/24, as the guest address. The page refused with “Invalid guest subnet 192.168.50.0/24 (overlaps 192.168.50.0/24 on rtr-lan; pick another address)”, and when I asked the API afterwards the address was still 192.168.30.1/24. The red box shows up at the top of the page though, above the part you’re looking at when you click Save, so on a laptop it looks like nothing happened until you scroll up.
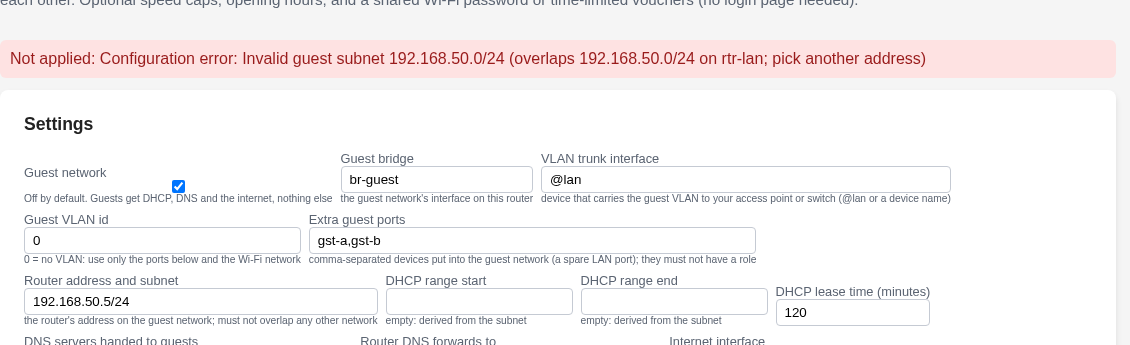
    A red message reading Not applied: Configuration error: Invalid guest subnet 192.168.50.0/24 overlaps 192.168.50.0/24 on rtr-lan, above the settings card with the address field filled with 192.168.50.5/24
    The refusal. The stored address did not change.

    The real save took between 0.7 and 0.8 seconds in four runs, measured from the click to the status card saying the bridge is up. Then I plugged in the two visitors.
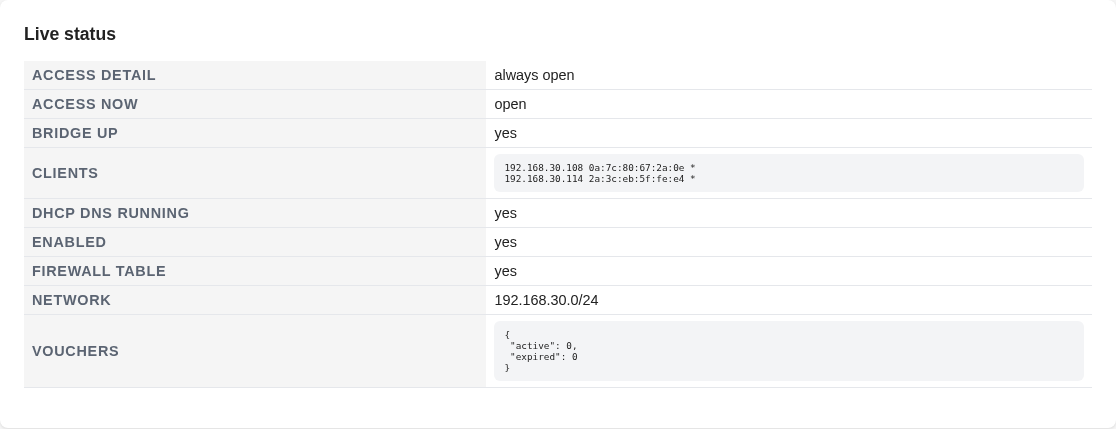
    The live status card showing bridge up yes, DHCP and DNS running yes, and two clients listed by address and MAC
    Status card with two guests. Clients are an address, a MAC and a star where a name would go.

    Being a visitor

    Both visitors got a lease from 192.168.30.1 with a 7200 second lease time (the default of 120 minutes), the router as gateway and DNS, and could fetch a page from the fake internet. The site saw the router’s WAN address, so the traffic is masqueraded. A ping to the router answers, which is a setting that defaults to on.
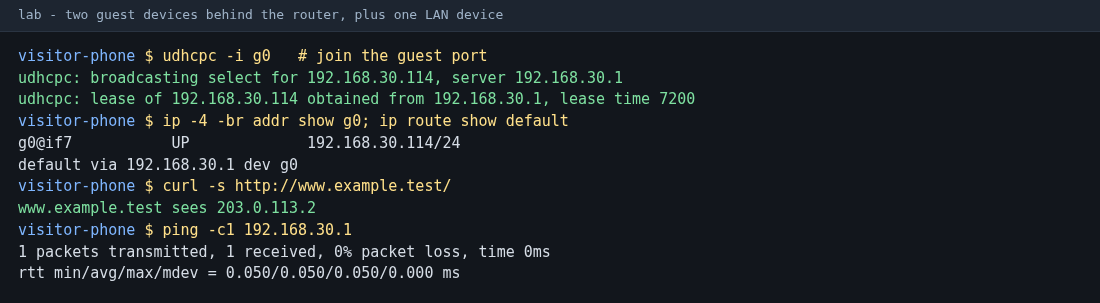
    Terminal output: a visitor runs udhcpc and gets 192.168.30.193 from 192.168.30.1, fetches www.example.test and sees the router's WAN address, and pings the router
    A visitor joins. Lab names and documentation addresses throughout.

    From the visitor I tried the NAS, the router’s admin page on its guest address, on its LAN address and on its WAN address, the modem’s page behind the WAN, and the other visitor. All six timed out. As a control, the LAN device fetched the NAS fine, and a LAN device trying to open a connection to a visitor also timed out, which is what the docs promise (nothing starts a connection into the guest network).
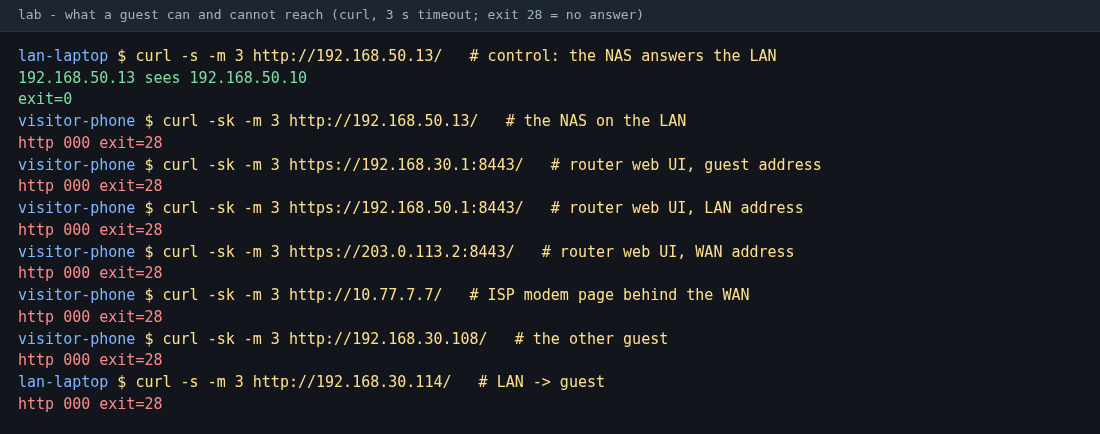
    Terminal output: the LAN device reaches the NAS, while the visitor's curl to the NAS, the router admin page on three addresses, the modem page and the other guest all end with exit 28, and a LAN device curling a guest also times out
    The LAN control fetch, then the six visitor probes. Exit 28 is curl giving up after 3 seconds.

    These are drops, so a visitor just waits for the timeout. I looked at the firewall to see why. The guest rules are their own nft table at priority -15, ahead of the main firewall, and its input chain ends with a drop commented “guests reach nothing else on the router”. The forward chain drops private ranges beyond the WAN, drops a source address that isn’t in the guest subnet, and the way back into the guest network only allows established flows.
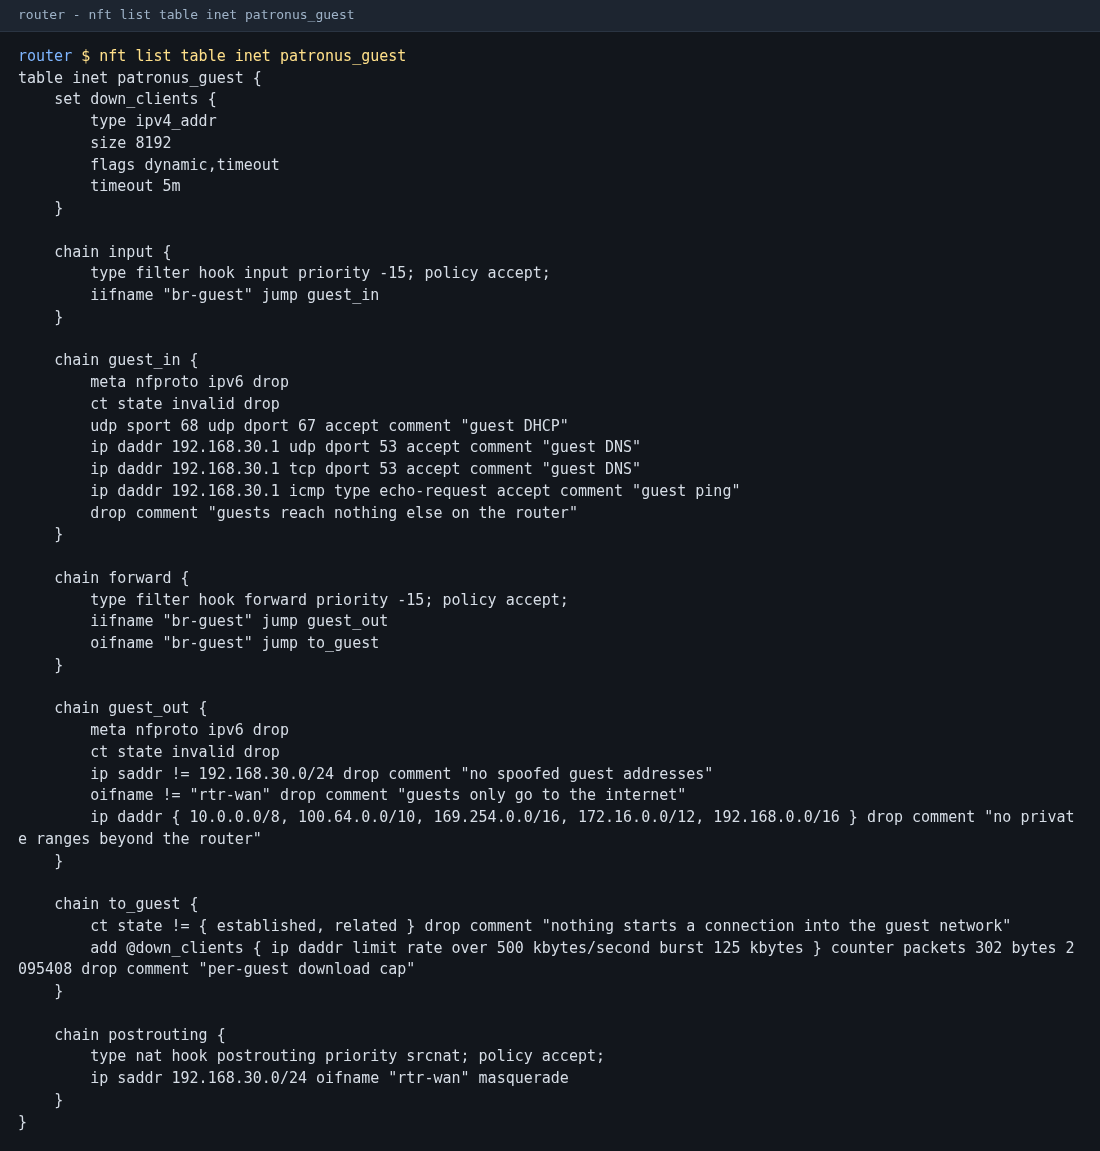
    Output of nft list table inet patronus_guest: input chain allowing DHCP, DNS and ping then dropping, forward chains guest_out and to_guest, a per-guest download cap set, and a masquerade rule
    The kernel’s view of the guest network. I removed one line of live meter entries, nothing else.

    The speed cap

    I set 4000 kbit/s per guest, which is 500 kilobytes a second. Each visitor downloaded for 8 seconds from a bulk server and curl reported 576,369 and 580,724 bytes a second. Across four runs the figures stayed between 576,000 and 581,000, about 15 percent over the setting. The docs say per-guest caps are policed with nft meters, that packets over the rate are dropped and that TCP settles somewhere near it, and they estimate the error at “within about 20 percent”. The LAN device on the same server got about 8.3 gigabytes a second through the lab’s virtual links, so the cap is the only thing slowing the visitors. I only tested the per-guest download cap, not the network-wide caps or either upload cap.

    Terminal output: two visitors measured at about 576 and 581 kilobytes per second, and the LAN device at over 8 gigabytes per second
    Measured with curl over 8 seconds. The LAN device number is the lab’s virtual link, not a real speed.

    Closing it, and the clip

    The page has buttons: new Wi-Fi password, new voucher, open for a while, close now, and show the password with a QR code. I pressed close now. The visitor’s internet request timed out, and a DHCP renew still worked, so the device keeps its address. DNS and ping to the router were refused. The docs say that’s intended: while closed, DHCP still answers and nothing else does.
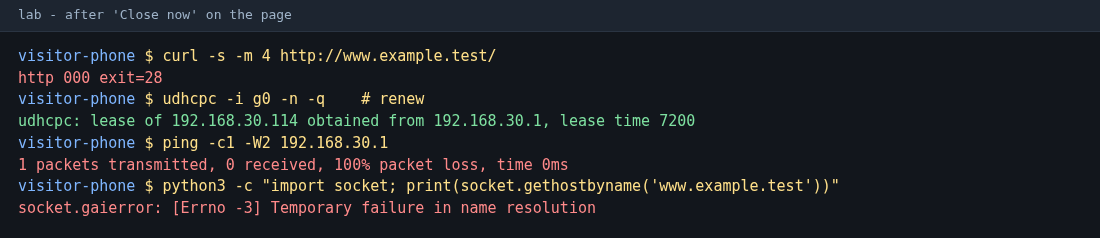
    Terminal output after pressing Close now: the visitor's curl times out, udhcpc renews a lease, ping to the router gets 100 percent loss, and a name lookup fails
    After Close now. The lease renews, nothing else works.

    The clip is a different run on the same lab, 37 seconds, real time. The router page is on top and a terminal is underneath: I switch it on from the form, a visitor joins, tries the NAS, the router page and the other visitor, I press close now, then open for a while, and the internet comes back. The two panes were recorded at the same time but separately, so don’t read anything into sub-second timing.

    Switch on, join, probe, close now, open for 120 minutes. Router page on top, terminal below. Lab clocks are real.

    The share card is the other button I used. It generates a 16 character password and shows it with the standard Wi-Fi join text and a QR code. It’s the demo password from my lab, and I didn’t scan the QR or join anything with it, because there is no radio in this lab.
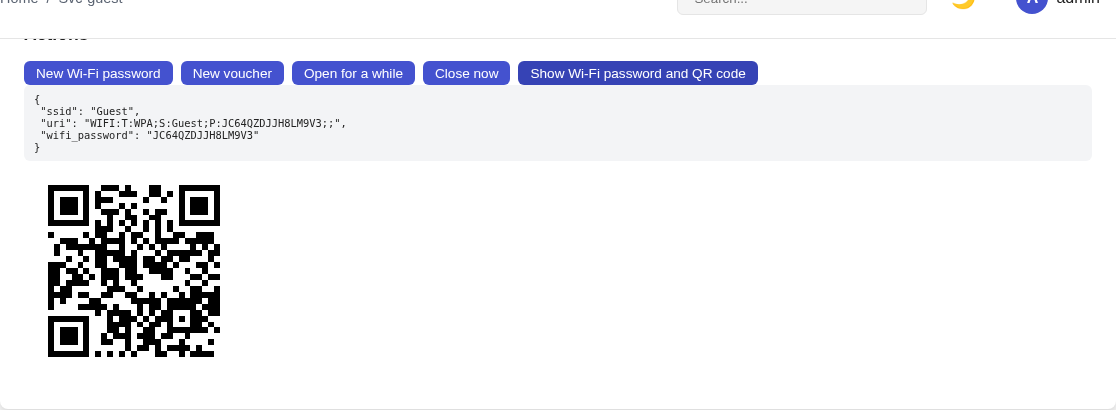
    The Actions card with five buttons and, below them, the guest SSID, a WIFI join string with a password, and a QR code
    The share card. Password is from the throwaway lab.

    What the docs say about the design

    Several choices are written down in docs/GUEST-NETWORK.md. The guest network is one bridge. VLAN sub-interfaces, spare ports and the guest SSID all join it, the ports are isolated from each other, and the SSID runs client isolation. The doc says plainly that a guest VLAN that continues onto an unmanaged switch can’t be isolated by the router, because the trunk is one bridge port. Guests get their own dnsmasq bound to the guest address only. Schedules and timed windows are nft rules, written that way “so they close by themselves, with no daemon” and survive a reboot. Vouchers are WPA2-only because stock hostapd reads SAE passwords only at start. The intro says it follows the way pfSense and OPNsense guest VLANs, OpenWrt guest networks and UniFi and Firewalla guest networks work. I haven’t done a feature-by-feature comparison against any of them.

    The docs don’t say why the default is 192.168.30.0/24 on VLAN 30, or why leases are 120 minutes, or why it ships switched off. They also don’t say why guest IPv6 is dropped, only that it isn’t supported yet. I don’t know why.

    What doesn’t work (yet)

    Worst bug: the status card shows the wrong state for schedules. I set the access mode to a daily schedule of 03:00 to 04:00 and looked at the card at 18:25 and again at 18:37 on the lab clock. The card said “schedule 03:00-04:00” and “access now: open”. The visitor’s request timed out both times, because the firewall rules were doing their job. When I changed the window to 00:00 to 23:59 the visitor got through. The rules are right and the label is wrong. I read the status function in guest.rs and it never checks the clock for a schedule, it just reports open.
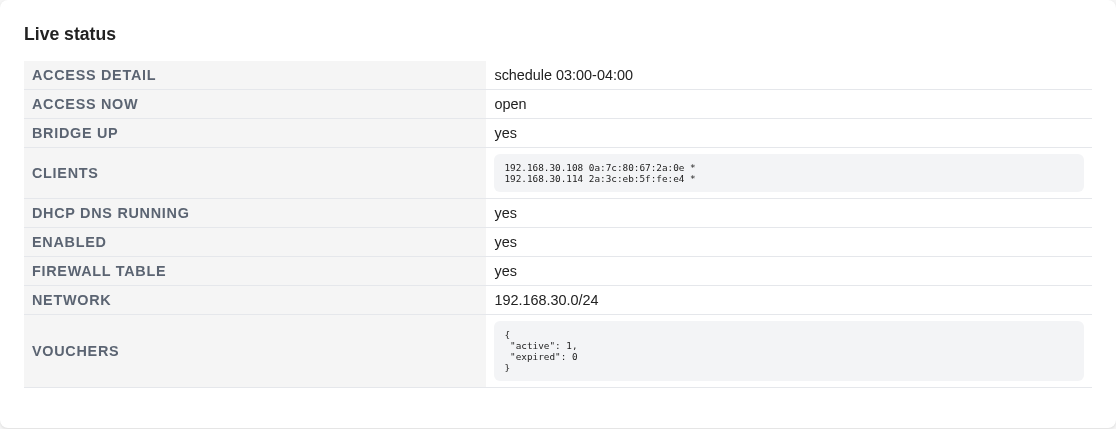
    The live status card showing ACCESS DETAIL schedule 03:00-04:00 and ACCESS NOW open
    The page says open. The visitor’s internet was closed when this was taken.

    Close now and Open for a while change the access mode to timed and leave it there. After “open for 120 minutes” the network closes by itself when the time runs out and stays shut until somebody opens it again, which the docs say. I didn’t wait it out. Switching back to always open is a separate step on the form.

    Smaller things. The header says “Home / Svc-guest”; a commit this morning fixed names like DHCP and DNS in the breadcrumb and this page didn’t get the same treatment. The form has “Open until (epoch seconds)” as a raw number. The minutes for open-for-a-while and for a voucher come from the browser’s own popup boxes. The clients list is an address and a MAC with a star where a hostname would be, and there is no way to kick one, which the docs list under “not yet”. On a 390 pixel wide phone the Guest network checkbox floats awkwardly next to its label. The status card looks fine there, but I only skimmed the long settings form.
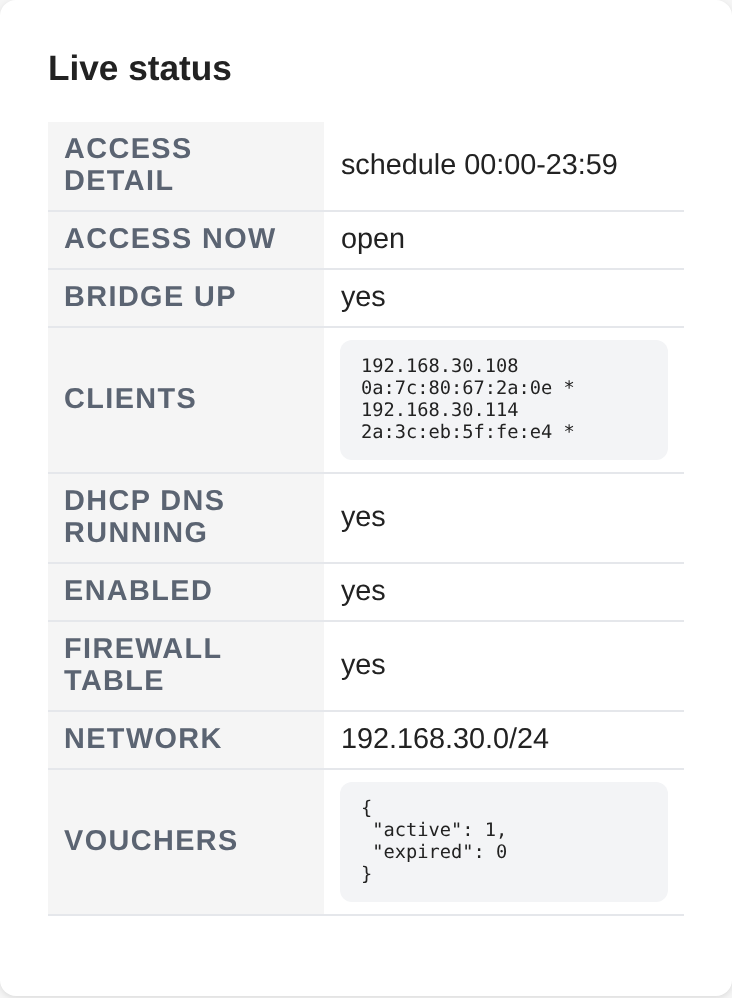
    The live status card on a 390 pixel wide phone, listing ACCESS DETAIL schedule 00:00-23:59, bridge up yes, two clients, DHCP and DNS running
    Status card on a phone. This was taken at the end of the session, after I’d set an all day schedule.

    What I didn’t test: Wi-Fi at all, VLAN mode, a reboot, IPv6 (guests are supposed to get none), a real phone or a real DHCP client, lease expiry, the network-wide caps, the upload caps, a voucher actually being used to join, and anything that ran longer than an hour. I created one voucher through the page (name weekend-visitor, 2880 minutes) and it showed up in the list, and that’s all I know about vouchers. The unit tests I ran pass: 22 in the network crate’s guest module, 2 in the web crate’s guest tests and 6 in the firewall rule tests. There is also a netlab lane for the guest network (the docs count 66 checks), a Wi-Fi lane on simulated radios and a Firefox test of the page. I didn’t run them.

    Where it stands

    It works in the lab: guests get internet and can’t reach anything else. The cap lands a little high. The page needs work, starting with the schedule status.

    Next: a phone joining by QR on real hardware, and a schedule left running for a full day. The status card gets fixed first.

    Patronus lives at patronus.errant.solutions.
  • Patronus: who is eating my uplink, and what it does when the ISP only half works

    Patronus: who is eating my uplink, and what it does when the ISP only half works

    Full disclosure: I make Patronus, a router and firewall OS built on Gentoo. It’s young. Version 0.2.0 came out on October 30.

    Two of the 0.2.0 pages I had only ever seen as test output. One is Traffic insight, which says which device talked to which country and network. The other is Uplink health, which watches each internet connection and is supposed to notice when one goes bad in a way ping doesn’t show. On November 15 I used both the way someone running a small network would: let some devices make noise, then break the ISP in three different ways.

    What this setup is

    Another lab, not my house. One container with a handful of network namespaces: the router (the real patronus-web and the apply daemon, built from main at commit 2f72a49c, 5 minutes 48 seconds cold on a capped CI box), four LAN devices with made-up names, two fake ISPs, and a fake internet on documentation addresses. WAN1 is labelled fibre and WAN2 is the LTE backup, in a failover group with WAN1 first. The traffic is real curl, ping and dig, and the browser does load the admin page.

    Some of it is fake. The country and network data is not DB-IP. I couldn’t use the real files in the lab, so I generated a file in the same format with ten address ranges, invented countries and invented companies such as “Beispiel Hosting GmbH”. Which country got how much traffic means nothing. I also sped the clocks up for the video (probe tick 2 seconds, history sample 3 seconds), then ran the same faults again at the production defaults, and the timings below come from those runs. None of it ran for longer than about an hour.

    Which device is using the bandwidth

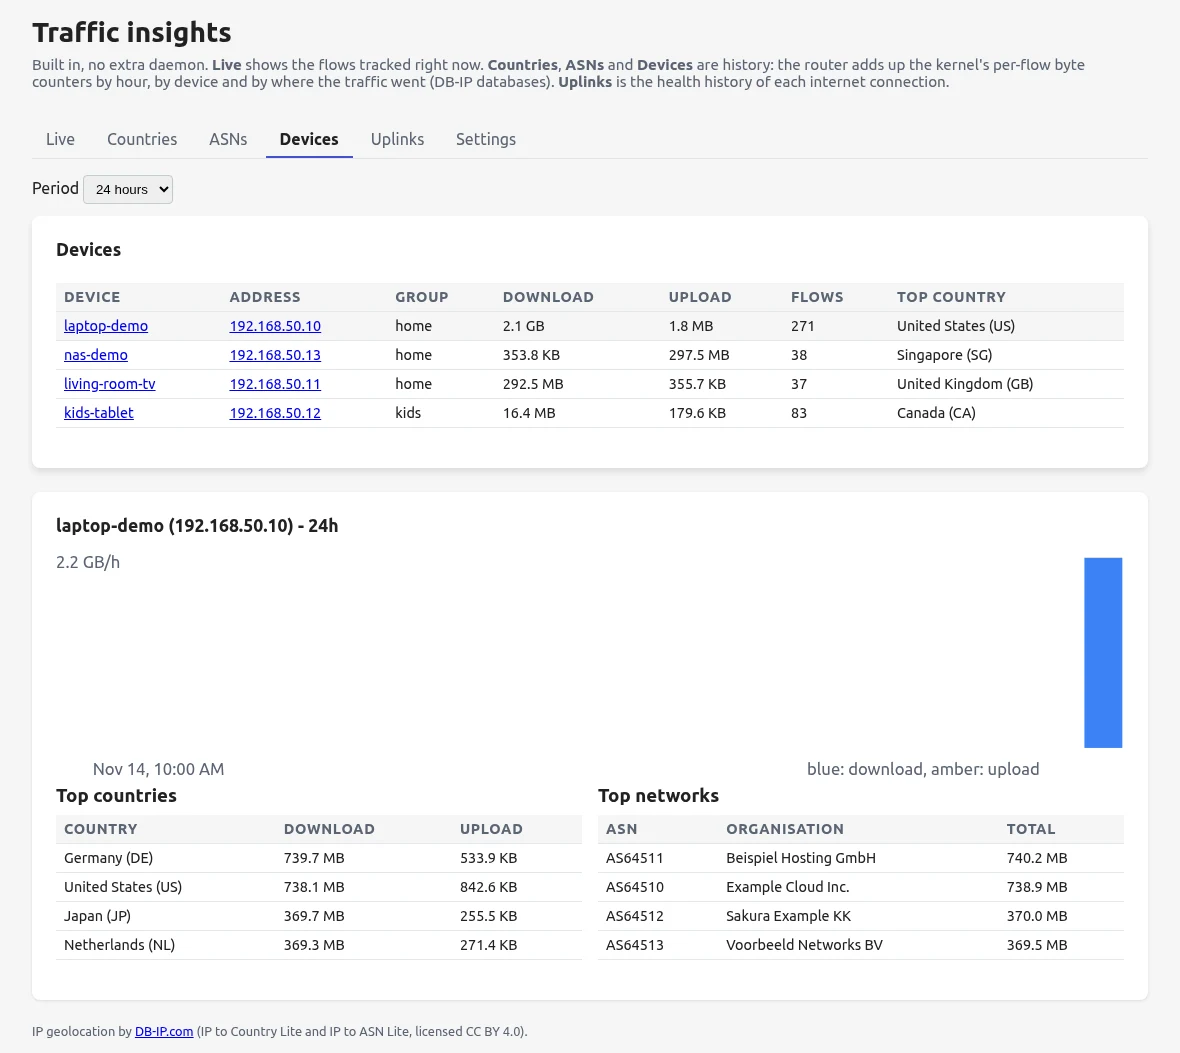
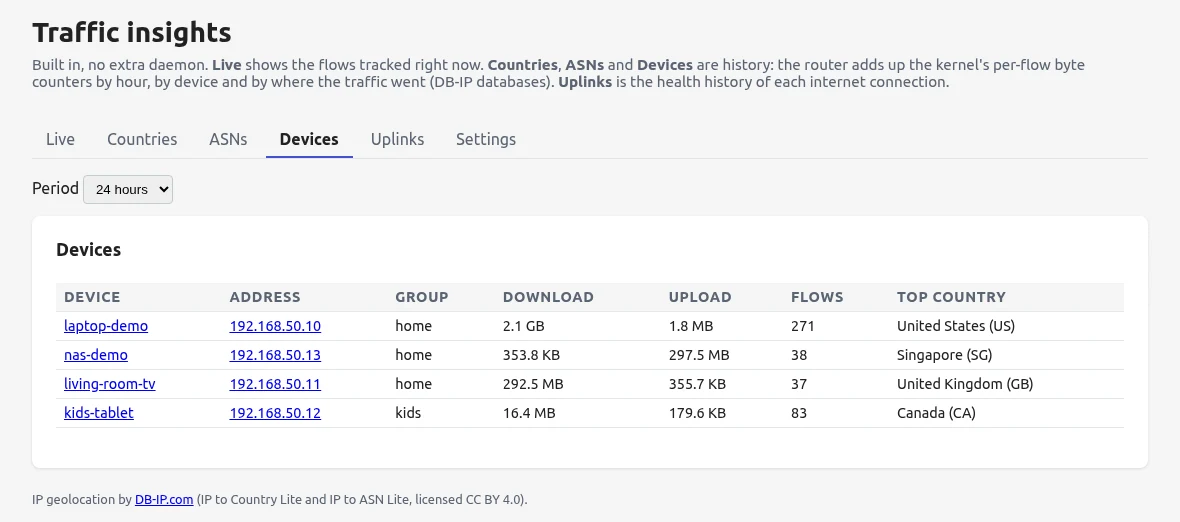
    The Insights page has a Live tab that shows flows right now, and history tabs for countries, networks and devices. The Devices tab was the one I wanted. After the lab devices had pushed traffic around for a while, laptop-demo had pulled 2.1 GB down, living-room-tv 292 MB, kids-tablet 16 MB, and nas-demo had pushed 297 MB up, which is what a backup job looks like.

    Devices tab: laptop-demo, nas-demo, living-room-tv and kids-tablet with download, upload, flows and top country
    The Devices tab, last 24 hours. The top-country column comes from my fake mapping file.

    Clicking a device gives an hourly bar and its top countries and networks.

    Per-device view of laptop-demo with an hourly bar, top countries and top networks
    laptop-demo. Everything in the bottom two tables is demo data.

    This is built from the kernel’s conntrack byte counters, not from a packet capture. A collector reads them every 15 seconds and adds the change in each flow’s counters to an hourly row for that device, direction, country and network. The design note gives the reason: the counters were already switched on by another part of the firewall and the parsing already existed. The same note admits that a flow which starts and ends between two reads loses up to one interval of bytes, and calls that acceptable.

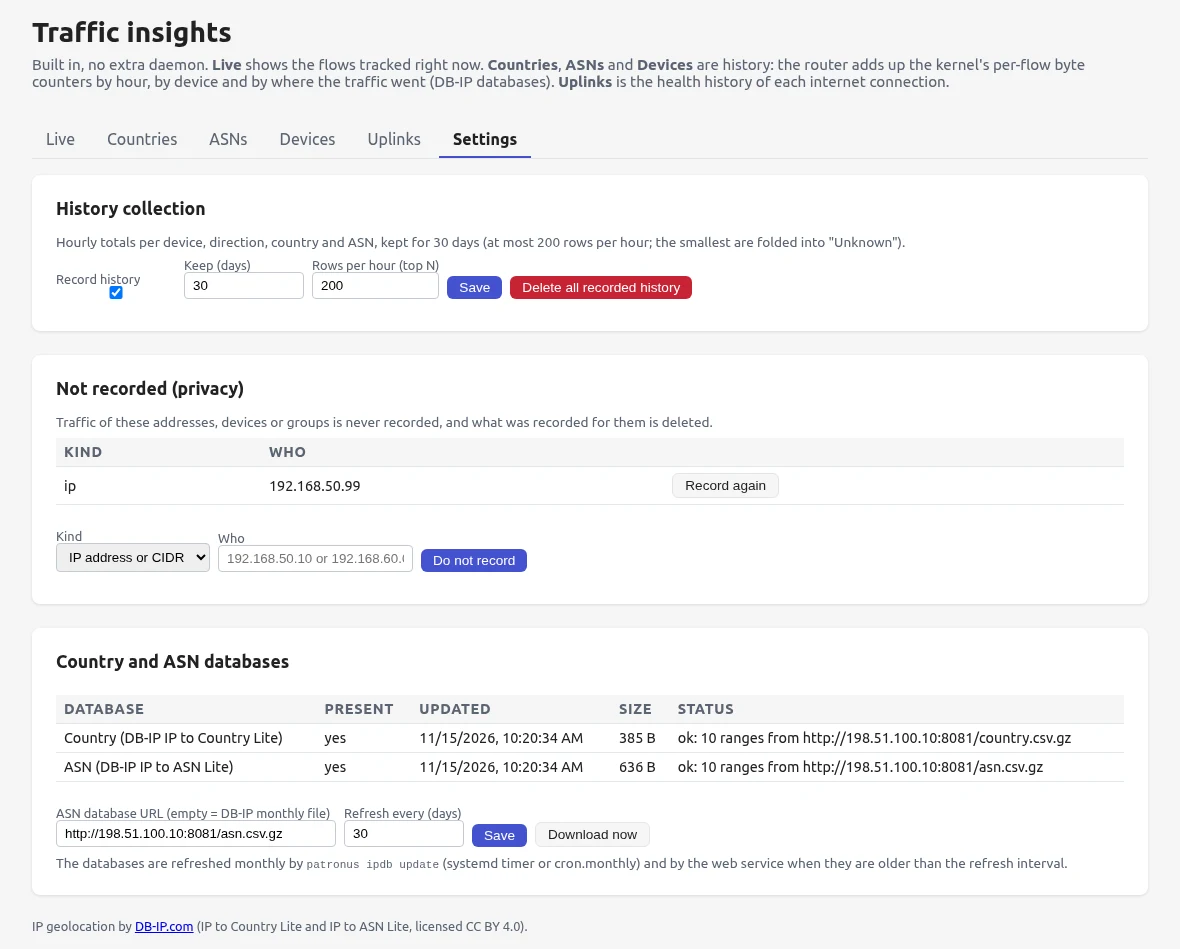
    There is a privacy page too. History is on by default for 30 days and 200 rows per hour. You can list addresses, devices or groups that are never recorded, and the docs say adding one deletes what was already recorded for it. I put my probe client on that list. The page also has a button that deletes all recorded history, which I left alone.

    Settings tab with retention settings, a not-recorded list holding one address, and the country and ASN database status
    Settings. The database rows show the lab URL my fake files came from.

    When the ISP only half works

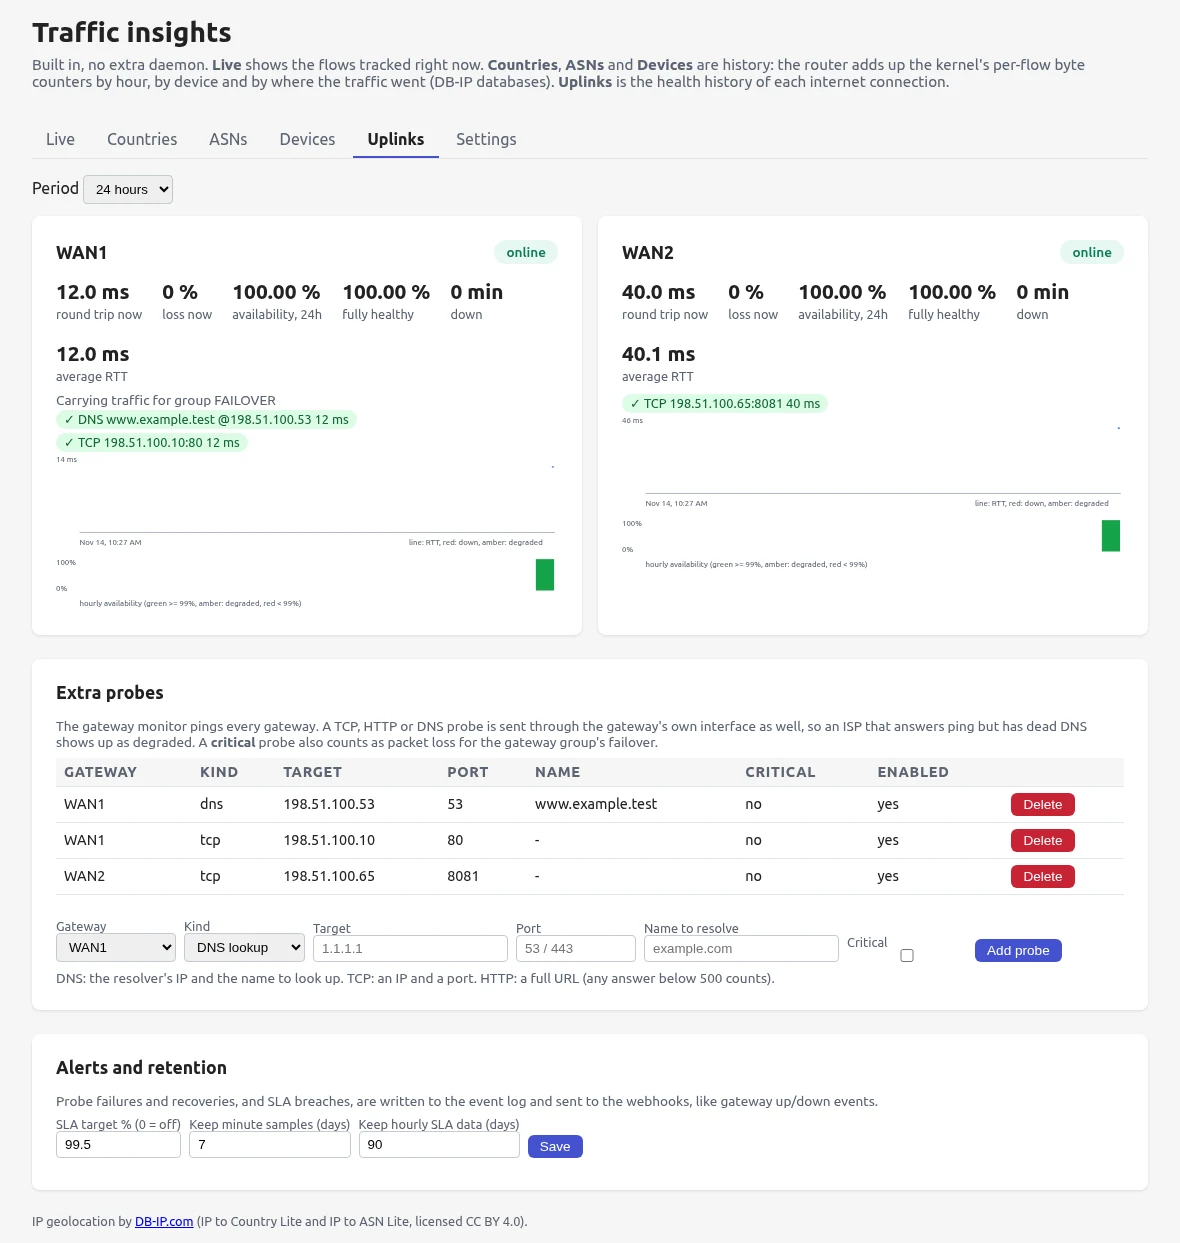
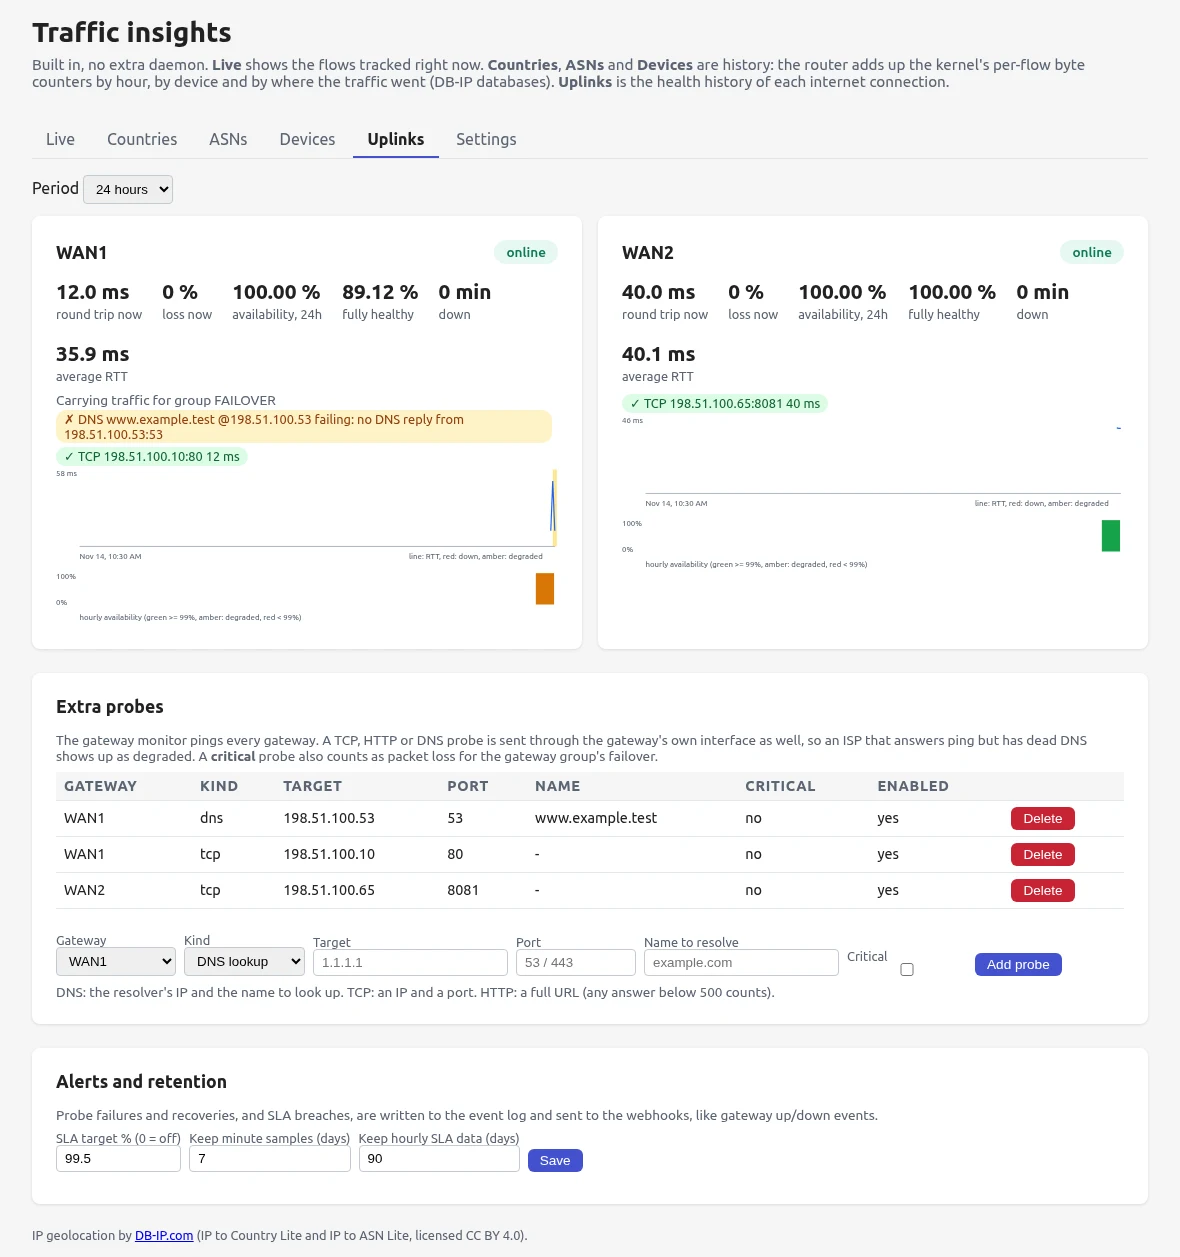
    The Uplinks tab shows each gateway with its state, round trip, loss, 24 hour availability and an hourly bar. WAN1 also had two extra probes, a DNS lookup against a resolver and a TCP connect, and WAN2 had a TCP probe. Those go out through the gateway’s own interface, so they test that link and not whichever one holds the default route. The SLA target was 99.5 percent, and the failover group switches on loss or on latency above 100 ms.

    Uplinks tab with both gateways online
    Both links healthy.

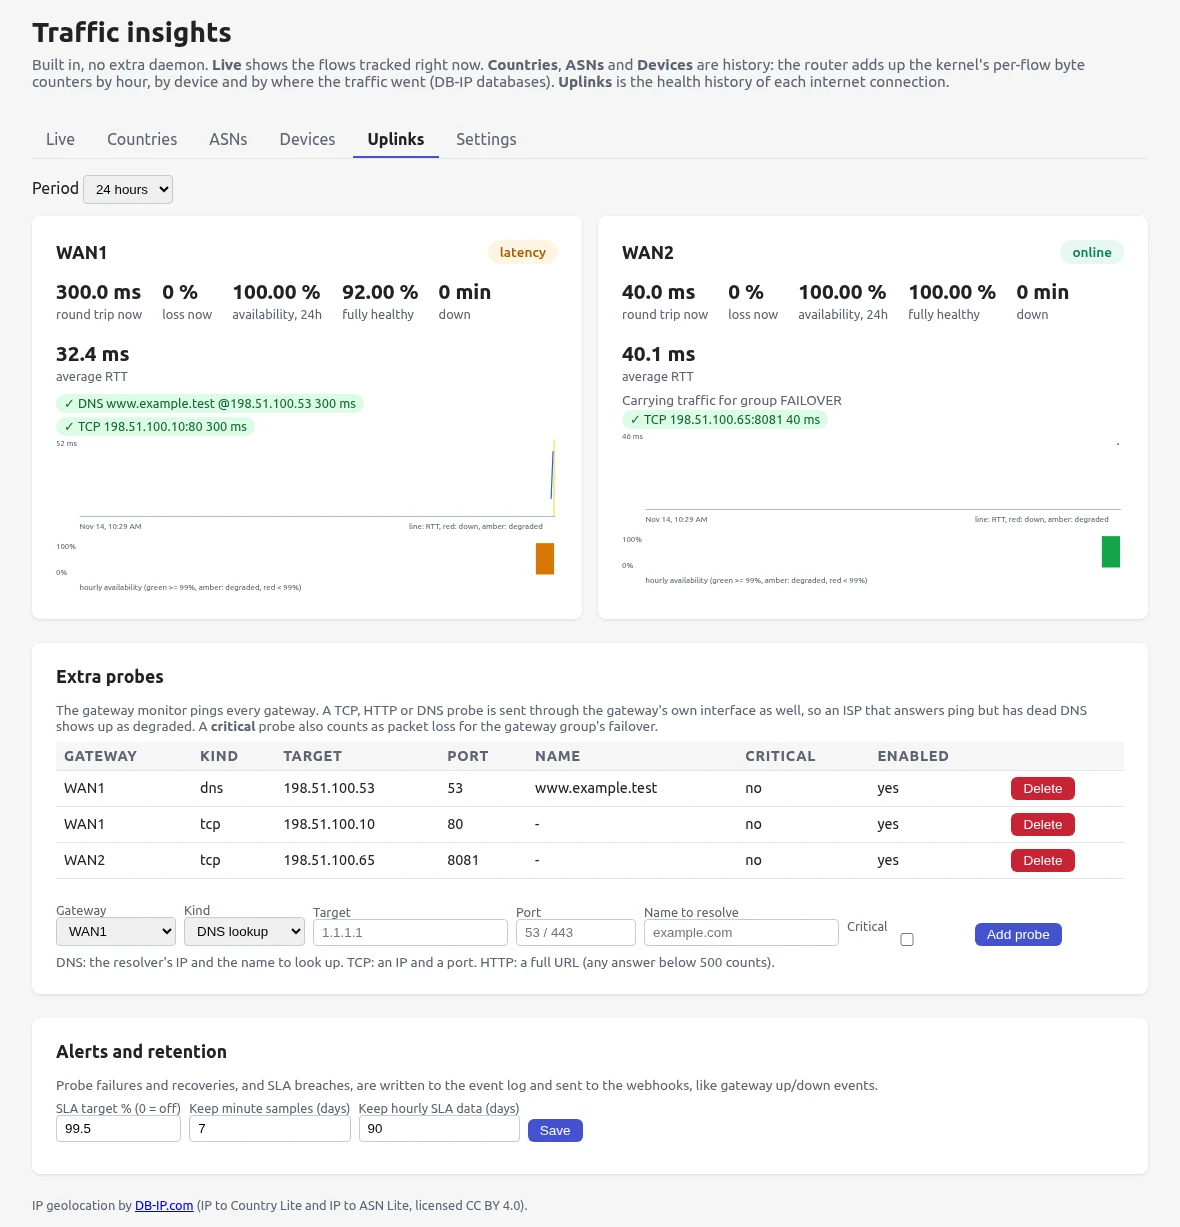
    First fault: 300 ms of delay on WAN1. WAN1 went to “latency” 3.3 seconds after I added it, and the router said the default route moved to WAN2 at 3.6 seconds. The events (gateway_degraded and group_failover) showed up at 8.2 seconds. When I took the delay off, WAN1 was healthy and the route back on it 7 seconds later.

    WAN1 marked latency at 300 ms round trip while WAN2 is online and carries the group
    WAN1 at 300 ms, WAN2 carrying traffic.

    Second, the ISP’s resolver stops answering while ping keeps working, which a ping-only monitor happily reports as fine. The probes did what the docs say. The DNS probe failed 10.7 seconds after the fault (it needs two misses in a row, 5 seconds apart) and the uplink_probe_failed event arrived at 17.4 seconds. Traffic stayed on WAN1, because a probe only moves traffic if you mark it critical.

    WAN1 still labelled online while its DNS probe fails, shown in amber
    WAN1 with a dead resolver. The label still says online.

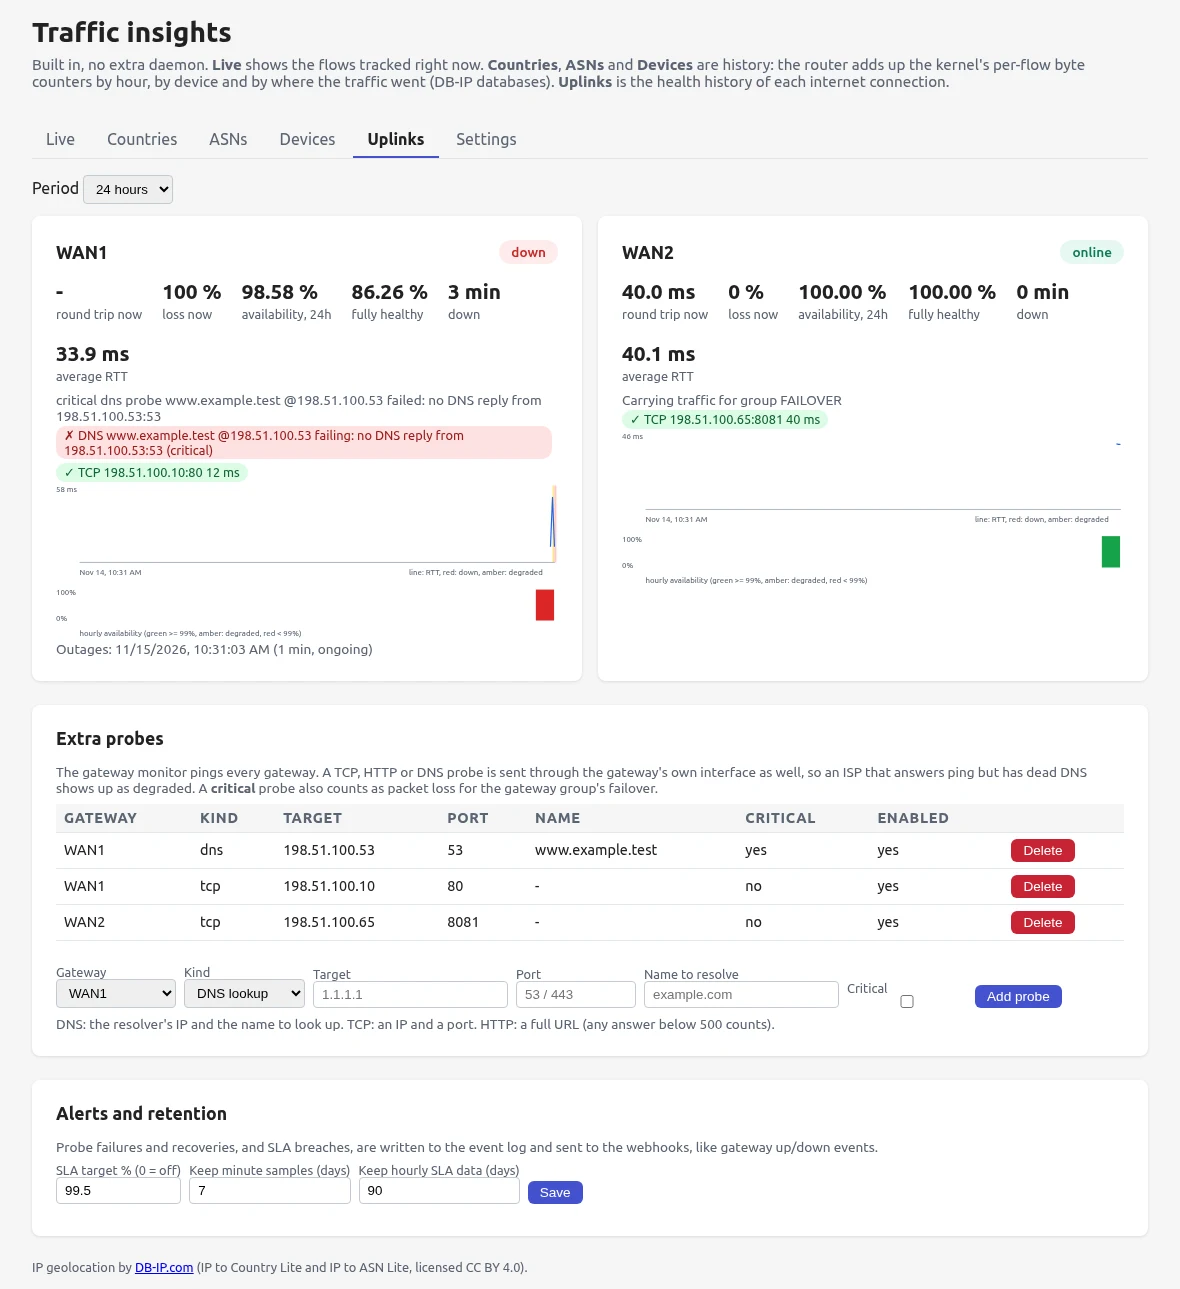
    Third: I marked the DNS probe critical, then broke the resolver again. Now a failing probe counts as packet loss. Ping to the ISP still answered the whole time, yet the router said the default route moved to WAN2 at 10.7 seconds, called WAN1 down at 13.8, and wrote gateway_down at 16.4. Fix the resolver and WAN1 was healthy again 10.4 seconds later, with the gateway_up event at 16.5.

    WAN1 labelled down with a red critical DNS probe failure and a one minute outage listed
    The same resolver outage with the probe marked critical.

    The clip is the DNS fault at the accelerated clock. At the top is the Uplinks page, in the middle is a LAN client that pings, resolves and fetches about once a second, and at the bottom is what the router API reports, polled every quarter second. I flip the probe to critical about 15 seconds in, and then you can watch loss, down, recovery and failback. The captions were added afterwards. I corrected one of them after looking at the result, and the reason is under the next heading.

    DNS outage, probe made critical, failover, recovery. 56 seconds, clocks accelerated, real time otherwise.
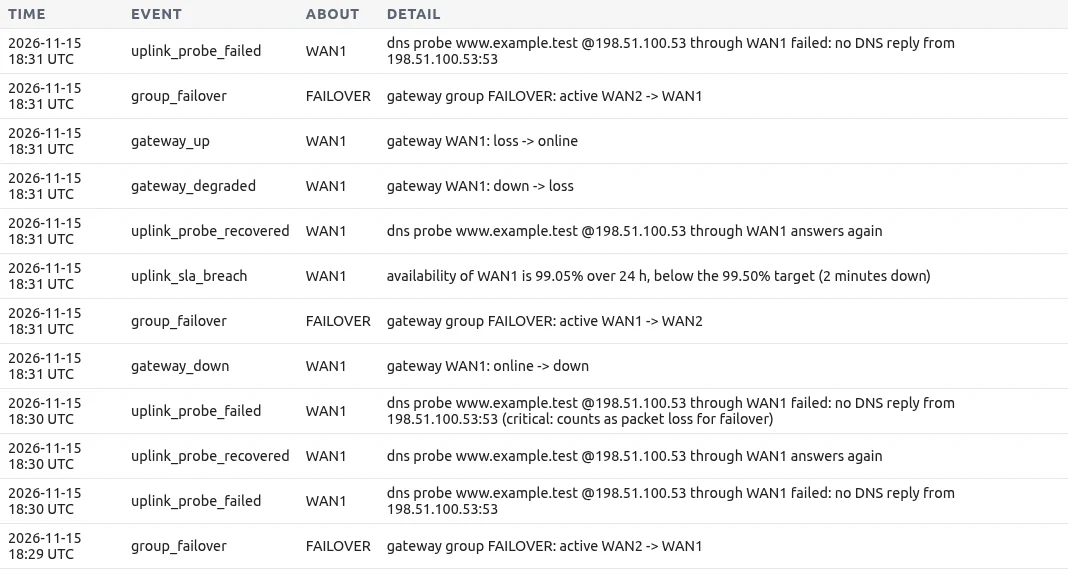
    Event log rows including gateway_down, uplink_sla_breach and uplink_probe_recovered
    The event log after a critical DNS outage, with the SLA breach in it.

    What the docs say about the design

    Most of the design is written down in two places, so I’m quoting them. History comes from conntrack because the counters and parser already existed. DB-IP is the data source because MaxMind’s free files need an account and a licence agreement, while Patronus already shipped DB-IP files that need neither. The history tables are kept out of config revisions and restores because, in the code’s own words, they are measured data that a rollback or restore may not rewind. The extra probes exist because an ISP can answer ping with broken DNS, and a probe has to fail twice in a row so one lost UDP packet doesn’t flap a WAN.

    Nobody wrote down why it’s 30 days and 200 rows, or why probes run every 5 seconds. The same goes for conntrack over NetFlow. I won’t make a reason up.

    What doesn’t work (yet)

    The one I’d fix first is in the clip. The router reports the default route moving to WAN2 at 22 seconds. The client lines in the same recording keep showing WAN1’s address for the rest of the clip. My first caption said the client now exited through WAN2. That was wrong, so I replaced it. I don’t know yet whether the fault is in my client script, in which routing table the LAN actually uses, or in Patronus. I didn’t get to dig before the lab was gone.

    A dead resolver with a non-critical probe leaves the WAN1 label on “online”, availability at 100 percent, and the traffic on WAN1. The amber shows up in the probe chip, the chart shading and the “fully healthy” percentage. The page’s own intro says such an ISP “shows up as degraded”, and the degraded flag my script polled stayed false. I haven’t checked whether a different field carries it.

    With the probe critical, one resolver outage turned WAN1 into “down” in about 14 seconds with ping working fine, and with a single probed resolver that’s a single point of false failover. It’s awkward to set, too. The probe table only has a Delete button and the critical box is on the add form, so I changed the existing probe through the API. There may be an edit path I missed.

    Events lag the state. At production defaults the recorder reads every 15 seconds, so gateway_down arrived about 2.6 seconds after the state changed and the probe failure event about 7 seconds after the probe failed. Failback is slow too: loss decays after the fix, so the route comes back around 10 seconds later and the up event about 6 seconds after that.

    The event log shows UTC times and the Uplinks card shows browser-local time, on the same page. The SLA text counts samples as minutes, so with my 3 second samples the breach event said “2 minutes down” for an outage of well under a minute. That’s an artifact of my sped-up sample setting, and I haven’t re-measured it at one sample a minute.

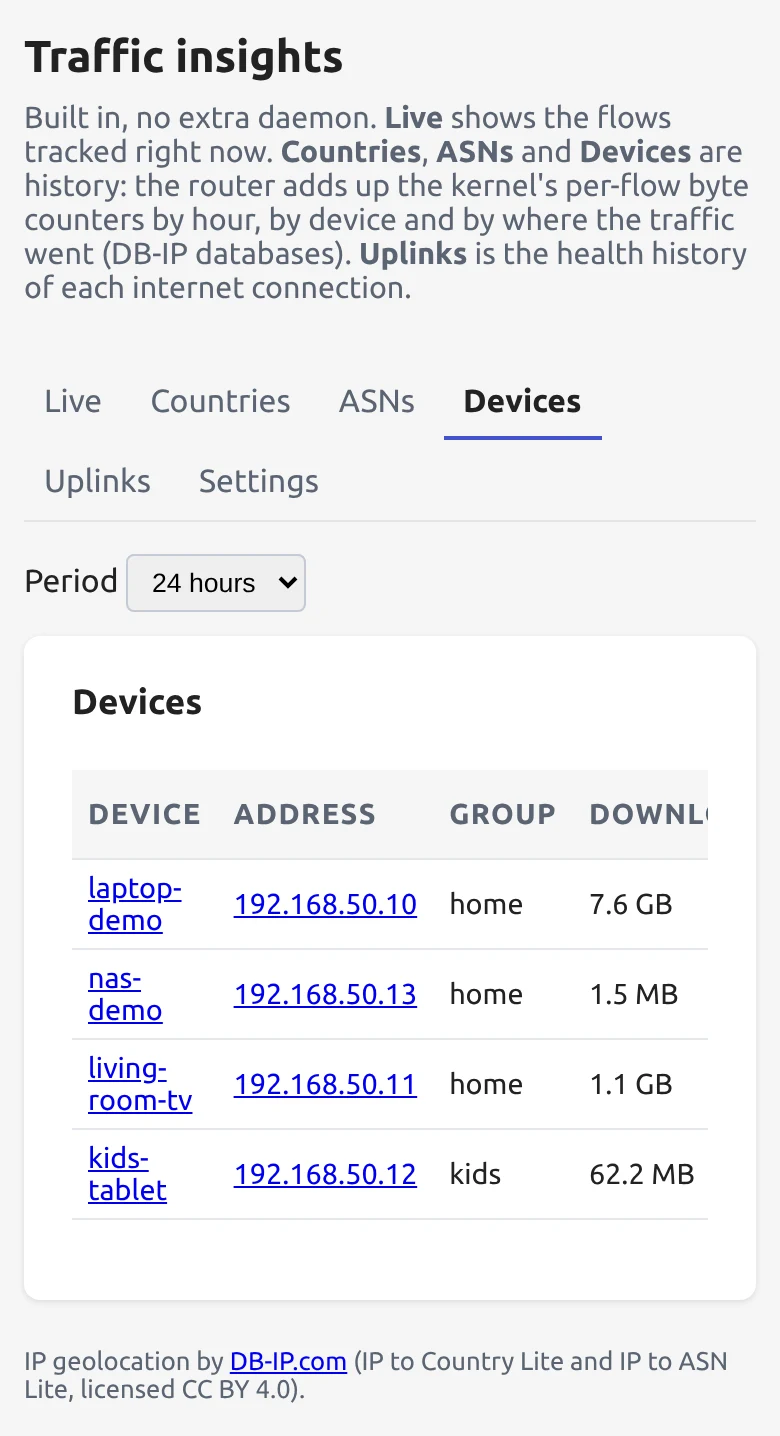
    On a 390 pixel phone the device table runs off the card at the Download column, and in my event-log capture only Time, Event and About were visible. I didn’t check whether it scrolls sideways.

    Devices table on a phone, cut off at the Download column
    Devices on a 390 pixel wide phone.

    Things I didn’t try at all: the real DB-IP files and the monthly refresh, IPv6 flows, port forwards, the top-200 cutoff and 30-day pruning, webhook delivery of the new event types, a device that changes address, and a real ISP. The two netlab scenarios for these pages exist and I didn’t run them. 51 unit tests for this code pass (26 insight, 11 uplink, 7 for the network database, 7 for the probes), and nothing has touched it since October 30.

    Where it stands

    The probes do catch an ISP that answers ping and nothing else. I’d like the page to say so more plainly: right now a probe only matters if you find the critical box, and the WAN1 label keeps saying online. I can’t judge the device history, since the data under it was fake. The routing question is the one I’ll chase first.

    Next: the real GeoIP files and a few days on a real clock, and finding out where that client’s traffic really went.

    Patronus lives at patronus.errant.solutions.
  • The Mystery of The Dying Wi-Fi

    The Mystery of The Dying Wi-Fi

    I recently migrated from a 802.11b/g/n mesh network with a base and two satellites to two standalone 802.11a/b/g/n/ac/ax access points. The reason for going from mesh to a two separate standalone APs was due in part to housing downsize and separating IoT, guests, and questionable devices from my personal, trusted, devices.

    Shortly after making the migration I started noticing frequent, but random disconnects on the 2.4GHz network on the IoT AP for about half a dozen devices. There are approximately 50 devices connected on this AP in total, so having 6 of them disconnect randomly seemed a bit odd. To make things even more interesting, these 6 devices would not automatically reconnect after they disconnect. Seems like a mystery is brewing, and I love a good mystery!

    I started digging into the mystery by making sure the AP had the latest firmware (it did) and confirmed the configuration settings were correct (they were.) Then I tried to identify anything in common between the 6 devices (they were all TP-Link Kasa smart devices.) I thought maybe one of the Kasa devices were malfunctioning and started taking them offline one at a time. No dice! The problem persisted!

    I continued my investigation trying various other things such as reducing the Wi-Fi protocol to only older ones and a bunch of other things. None of this really made much difference outside of slowing down the disconnect rate of the 6 devices.

    Eventually I decided something else must be going on so I set up logging on the AP and had the logs shipped to a machine on my network that runs rsyslog. I went through the logs and discovered something that was not visible in the APs interface nor in the normal event logs: there was a unknown device attempting to connect about once per second but failing to complete the connection. Looking up the MAC address revealed that is was manufactured by “Tuya Smart Inc.”

    Knowing the manufacturer didn’t really help that much other than tell me it was some sort of “smart” device. The next step was a process of elemination where I went throughout the house unplugging every smart device for a few minutes at a time by either unplugging them, which did not reveal the mystery device, or by turning the breakers off in the electrical box. I eventually narrowed things down to one room.

    Once I began looking at what was present and plugged in, I realized there was a “smart” thermometer on the wall in this room. As it turns out, this thing has Wi-Fi, and was not connecting correctly. After removing the power (AC and batteries) the constant connection attempts on the AP completely stopped. The reason this went unnoticed for months was because I do not use the app associated with this “smart” thermometer, but my spouse occasionally does. Apparently she hadn’t used it for a few months to notice it wasn’t working any longer…

    I ended up doing a factory reset on the “smart” thermometer, reconfigured it, and it has been behaving fine since (a few years now).

    Mystery solved!