Tag: Incident Response

  • Designing an Incident Response Runbook That Actually Gets Used Under Pressure

    Designing an Incident Response Runbook That Actually Gets Used Under Pressure

    Most incident response docs die the same death. Someone writes them once, during a calm retrospective, optimizing for completeness instead of usability. Six months later it’s 3 a.m., PagerDuty is screaming, there’s a VP in the Slack channel, and nobody opens the doc, because reading five paragraphs of prose to figure out what to do first is cognitively impossible under stress. I’ve watched competent engineers abandon a 40-page “IR plan” in under 90 seconds and just start guessing. The plan wasn’t wrong. It was unusable.

    A runbook that documents your incident process and a runbook that gets followed when your hands are shaking are two different documents.

    Why prose-heavy runbooks fail
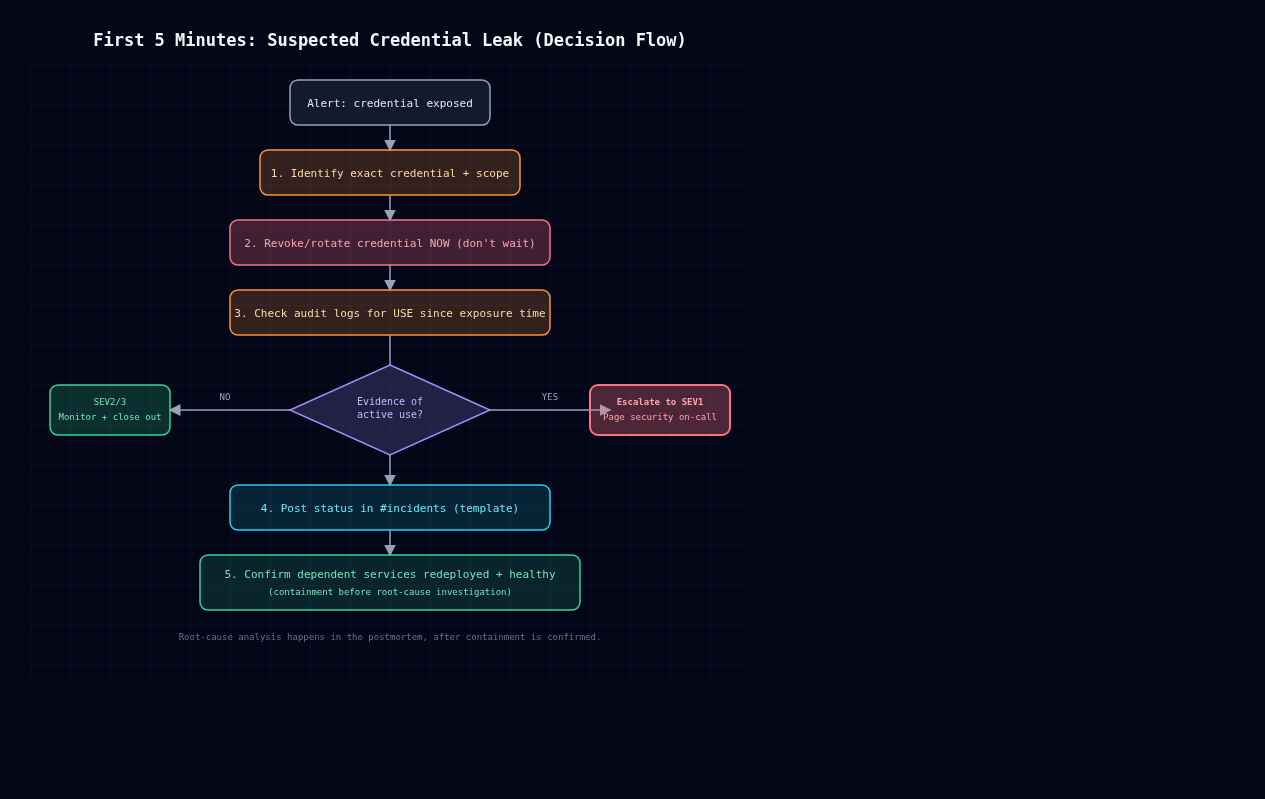
    Decision flow diagram for a credential-leak incident response runbook

    Under acute stress, working memory collapses. You lose the ability to parse nested conditionals, skim for relevance, or hold context across paragraphs. That’s neurology, not a discipline problem. A document that reads like a design doc (“In the event that database replication lag exceeds acceptable thresholds, engineers should first consider…”) demands exactly the kind of sustained reading comprehension that incident stress destroys.

    I keep seeing the same three failure modes.

    No entry point. The doc assumes you already know which section applies. There’s no triage step that gets you from “something’s wrong” to “page 14” in under 10 seconds.

    Decisions buried in narrative. The actual decision (“page the DBA if X, roll back if Y”) sits in sentence four of paragraph three, surrounded by justification nobody needs mid-incident.

    Root-cause bias. The doc walks you toward understanding why before it tells you how to stop the bleeding. In a live incident, causality is a luxury. Containment is not.

    Better prose won’t fix this. Build runbooks as flowcharts and checklists first, and demote prose to footnotes and postmortem material.

    What a usable structure looks like

    Every runbook entry should be scannable top to bottom in the order a responder actually needs it, not the order that’s intellectually tidy.

    1. Trigger conditions: the literal alert names, dashboard thresholds, or symptom descriptions that mean “this runbook applies.” Not “if the database seems slow,” the actual PromQL alert name or Datadog monitor ID. Ambiguity here is the single biggest cause of wasted minutes.

    2. Severity tiers, defined by observable impact, not by vibes:

    SEV1: customer-facing outage or data integrity risk, all hands, exec notified
    SEV2: degraded service, workaround exists, on-call + lead notified
    SEV3: internal-only or single-component failure, on-call handles solo

    Tie the tier directly to escalation and comms obligations below. Don’t make the responder infer what SEV2 implies.

    3. First-5-minutes checklist: literal checkboxes, imperative verbs, zero interpretation required. This is the part people actually execute, so it has to survive being read by someone operating at 60% cognitive capacity.

    4. Escalation path: who, in what order, by what channel, with what SLA for response. Include a fallback if the primary doesn’t ack in N minutes. Name the PagerDuty schedule, the phone number, the backup. “Escalate” can’t be a vague gesture.

    5. Communication templates: pre-written, fill-in-the-blank status updates for internal Slack, status page, and customer-facing comms if applicable. Nobody should be composing prose for stakeholders while also fighting the fire.

    6. Containment and rollback steps, before root-cause investigation. This is the part teams get backwards most often. The runbook should assume the goal is “stop customer impact,” not “understand the bug.” Rollback, failover, feature-flag kill, traffic shedding, whatever gets you back to a known-good state comes before anyone opens a debugger or starts reading logs line by line. Root cause is a postmortem activity, not an incident-response one, unless root cause is the fix (killing a single bad host, say).

    Everything else, architecture diagrams, why the system is built this way, historical context, belongs in a linked reference doc, not the runbook itself. If it’s not actionable in the first 15 minutes, it doesn’t belong above the fold.

    Concrete example: suspected credential leak

    Take a credential or API key suspected to be exposed (committed to a public repo, leaked in a log, found in a pastebin).

    RUNBOOK: Suspected Credential Leak
    
    TRIGGER CONDITIONS
    - GitHub secret-scanning alert fired
    - Credential found in public repo, log aggregator, or third-party report
    - Any employee reports pasting a secret into a public channel/tool
    
    SEVERITY
    SEV1 if: production DB creds, cloud provider root/admin keys, payment
             processor keys
    SEV2 if: scoped service credentials, internal-only API keys
    SEV3 if: already-rotated or non-functional/test credentials
    
    FIRST 5 MINUTES (do these in order, do not skip to investigation)
    [ ] 1. Identify exact credential(s) exposed (name, system, scope)
    [ ] 2. Revoke/rotate the credential at the source NOW
           - AWS: `aws iam update-access-key --access-key-id <id> --status Inactive`
           - DB: rotate password, update secrets manager, do not wait for
             app redeploy to confirm, deactivate first
    [ ] 3. Check access/audit logs for USE of the credential since exposure
           timestamp (not since discovery timestamp)
    [ ] 4. If evidence of use: treat as active compromise, escalate to SEV1,
           page security on-call immediately
    [ ] 5. Post initial status in #incidents using template below
    
    ESCALATION
    - Page: Security on-call (PagerDuty "sec-oncall"), ack SLA 5 min
    - If no ack in 5 min: page Security team lead directly (see contacts doc)
    - SEV1: notify Eng Director + CISO via phone, not Slack
    
    COMMUNICATION TEMPLATE (#incidents channel)
        INCIDENT: Credential exposure - [system/service]
        Severity: [SEV1/2/3]
        Status: [Contained / Investigating / Monitoring]
        Credential rotated: [Y/N, timestamp]
        Evidence of misuse: [Y/N, details]
        Next update: [time]
        IC: [name]
    
    CONTAINMENT (before root-cause)
    [ ] Credential rotated/revoked (confirmed, not assumed)
    [ ] Dependent services redeployed with new credential and confirmed healthy
    [ ] If public repo: force-push history rewrite or purge via GitHub support;
        assume cached copies exist regardless (CDN/scraper mirrors), rotation
        is the real fix, not deletion
    [ ] If evidence of use: lock down affected resource (IP allowlist, disable
        key entirely) even if it breaks a dependent system, customer data
        risk outweighs availability here
    
    ROOT CAUSE (postmortem, after containment confirmed)
    - How did the credential reach a public/exposed location?
    - Was secret-scanning in place on this repo/pipeline? If not, why not?
    - Time from exposure to detection, and detection to rotation

    The excerpt leaves things out on purpose. It doesn’t explain OAuth, doesn’t lecture on secrets-management philosophy, doesn’t walk through how secret scanners work under the hood. All of that lives elsewhere. This section has one job: get a half-asleep on-call engineer from “alert fired” to “credential is dead and we know if it was misused” in under ten minutes, with zero ambiguity about who to call next.

    Keeping it alive

    A runbook this terse goes stale fast if nobody exercises it. I’ve seen teams write a beautiful one and then watch it rot for two years because it never got touched. Two practices help.

    Run it in tabletop exercises quarterly, with someone unfamiliar with the specific system reading it cold. If they get stuck or have to ask what a step means, that’s a bug in the doc, not the reader.

    Update it in the postmortem of every real incident it was used for. If a step was ambiguous or missing during the actual event, fix it that week. Runbooks nobody touches after a real use are already decaying, whether anyone notices or not.

    I’d take an unimpressive document that a tired, stressed, possibly junior engineer can execute correctly without me in the room. Write for that person, not for the auditor who’ll read it later.

  • Alert fatigue: tuning detections without going blind

    Alert fatigue: tuning detections without going blind

    Part 3 of 3 in the Detection engineering series. Part 1: Logging that actually helps an investigation. Part 2: Writing detections as code: Sigma rules tested against real logs.

    In 2013, attackers inside Target’s network set off malware alerts from a detection tool the company had recently deployed. The alerts reached Target’s security team, and the US Senate Commerce Committee’s 2014 kill chain analysis of the breach concluded they weren’t acted on in time. Roughly 40 million payment cards were stolen. The tool worked. The process around it didn’t.

    That pattern repeats everywhere I’ve looked. When a team gets hundreds of alerts a day and nearly all of them are benign, people learn, quite rationally, that alerts are probably nothing. Then the real one gets the same treatment.

    This is part 3 of the series. Part 1 covered collecting the right events and part 2 covered writing and testing detections as code. Now we have to live with them.

    Measure before you tune

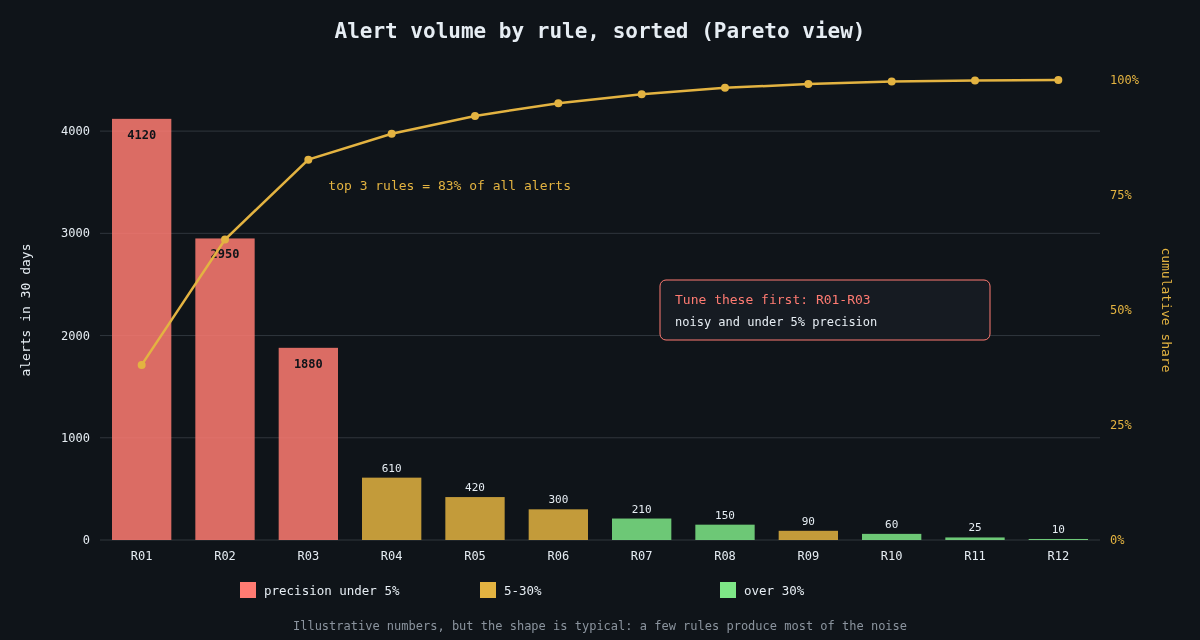
    Illustrative Pareto chart of 30-day alert volume by detection rule, coloured by precision

    You can’t tune what you don’t count. For every rule, track three numbers over a rolling 30 days: how many alerts it produced, how many were true positives after triage, and how long triage took. Precision per rule (true positives divided by total alerts) is the most useful single figure, and it’s almost never on the SIEM dashboard by default.

    That means analysts have to record a disposition when they close an alert. Keep the choices small and honest: true positive, benign true positive (the rule matched what it was meant to, but the activity was authorised), false positive, and needs tuning. The “benign true positive” bucket matters, because an admin running a scanner is not the rule being wrong, and conflating the two leads to deleting good rules.

    When you plot alert volume by rule, you’ll nearly always find that a handful of rules generate most of the noise. That’s good news. You don’t have to fix everything, just the top few.

    Tune narrowly

    The lazy fix for a noisy rule is excluding the whole host, the whole service account, or the whole subnet. Each of those is a hole an intruder can stand in. If your backup server is excluded from the PowerShell rule because its jobs are noisy, then PowerShell on the backup server is now invisible, and backup servers are exactly what ransomware operators go looking for.

    Make exceptions as specific as the evidence allows: the exact parent process, the exact command line or script path, ideally the file hash and the expected account. In Sigma that’s a named filter in the rule itself:

    detection:
      selection:
        Image|endswith: '\powershell.exe'
        CommandLine|contains: ' -EncodedCommand '
      filter_backup_job:
        ParentImage: 'C:\Program Files\BackupAgent\scheduler.exe'
        User: 'CORP\svc-backup'
        CommandLine|contains: 'C:\BackupAgent\scripts\prejob.ps1'
      condition: selection and not filter_backup_job

    If the backup agent is compromised and starts running something else, the filter no longer matches and the alert fires.

    Give every exception an owner and an expiry

    Exceptions accumulate like firewall rules. Nobody remembers why half of them exist, and nobody dares remove them. Store them in the repository with metadata, and let CI enforce it:

    # exceptions/powershell-encoded.yml
    rule_id: 0c4b3a9e-71d2-4f5e-9b8a-6e2d1c7f3a10
    filter: filter_backup_job
    reason: Vendor pre-job script uses encoded commands (ticket SEC-1432)
    owner: infra-backup
    expires: 2027-01-31
    import datetime, glob, sys, yaml
    
    today = datetime.date.today()
    expired = []
    for path in glob.glob("exceptions/*.yml"):
        with open(path) as f:
            doc = yaml.safe_load(f)
        if doc["expires"] <= today:
            expired.append(f'{path}: owner {doc["owner"]}, expired {doc["expires"]}')
    
    if expired:
        print("\n".join(expired))
        sys.exit(1)

    When an exception expires, the owner either renews it with a fresh justification or it goes away. Ninety days is a reasonable default. It’s mildly annoying, and that’s what keeps the list short.

    Change what happens, not just whether it fires

    Not every detection should page a human. A lot of useful signals are weak on their own: a new admin tool on a workstation, a login from an unusual country, a service account authenticating interactively. Individually each one is noisy. Together, on the same host or user within a few hours, they tell a story.

    That’s the idea behind risk-based alerting. Low-fidelity rules don’t create alerts; they add a risk score to the user or host they involve. A separate correlation rule fires when an entity’s accumulated score crosses a threshold, or when signals from several distinct ATT&CK tactics appear together. Splunk documents this approach as its RBA framework, but you can build the same thing in any SIEM that can aggregate by entity over a time window.

    Alongside that, route by confidence. High-precision rules page someone. Medium ones land in a queue that’s worked during business hours. The rest feed risk scores and dashboards. A rule that has never produced a true positive in a year and doesn’t feed anything is a candidate for retirement, but only after you’ve confirmed it can still fire (see the next section), because a rule that never fires might be a rule that’s broken.

    Prove you’re not blind

    Tuning removes alerts. The danger is that you can’t easily see the alerts you removed, or the ones that stopped firing because a log source died. So you need a positive signal that coverage still exists.

    Part 2 described scheduled end-to-end tests: a harmless, known action on a test host that a specific rule must catch within minutes. Run those continuously, track the pass rate per rule, and treat a failure as an incident in the detection pipeline. Combine it with a per-source volume monitor so that a domain controller going quiet raises its own alert.

    I also like a quarterly review of the top 20 noisiest rules and every rule with zero alerts. The noisy ones need tuning. The silent ones need a test proving they still work.

    Watch the humans

    The last metric is the analysts themselves. If one person is triaging 200 alerts per shift, median triage time drops to seconds and the quality goes with it. Track alerts per analyst-hour and the share of alerts closed in under a minute. When those climb, the fix is in the rules, not in telling people to try harder.

    A detection program is healthy when an alert is rare enough that people still feel a small jolt when one arrives. Getting there is mostly unglamorous bookkeeping, and it’s worth every hour.

  • Logging that actually helps an investigation

    Logging that actually helps an investigation

    Part 1 of 3 in the Detection engineering series.

    Most logging in a typical company was set up by developers to debug things. That’s a fine goal, and it produces logs that are close to useless when a security incident lands. Debug logs tell you a function threw an exception. An investigation needs to know which account did what, from where, against which object, and whether it worked.

    I’ve sat in enough incident calls to know the moment it goes wrong. Someone asks “when did this start, and what else did that account touch?” and the room goes quiet, because the answer either rolled out of retention last week or was never written down.

    Start from the questions, not the log sources

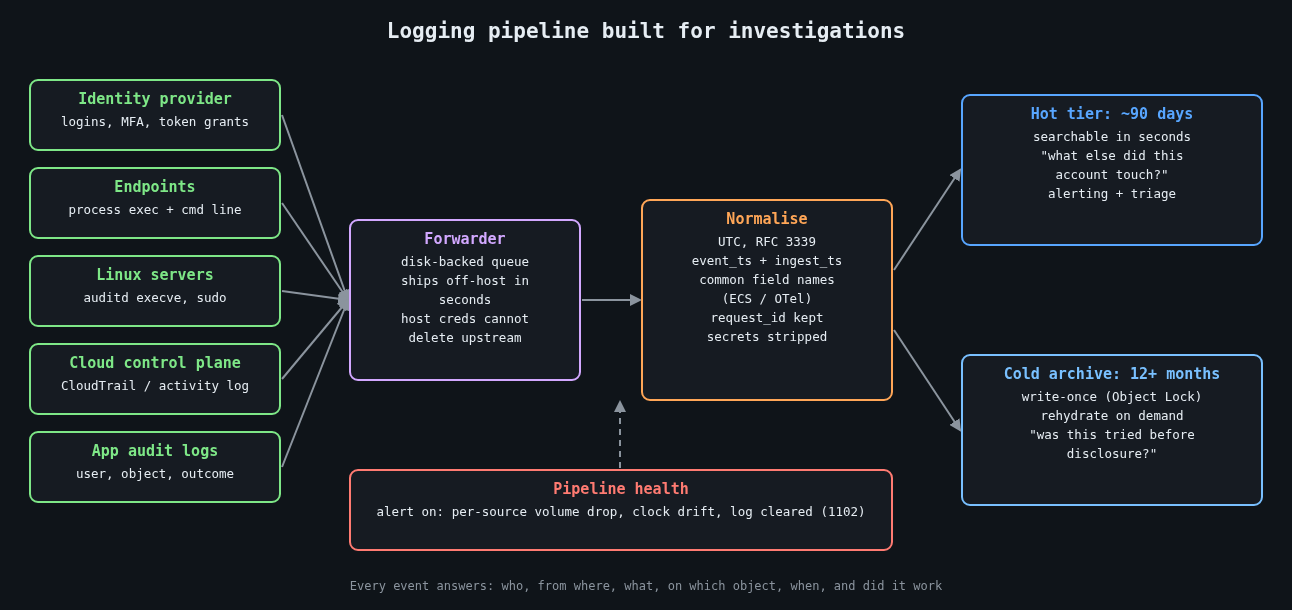
    Logging pipeline built for investigations: sources, forwarder, normalisation, hot and cold tiers

    Before turning on anything, write down the questions an investigator will ask. They’re boringly consistent from incident to incident:

    • Which identity performed the action, and was it a human, a service account or a token?
    • Where did the request come from (source IP, device, user agent, parent process)?
    • What was the action and what object did it touch?
    • When exactly, and in what order relative to other events?
    • Did it succeed?

    Every security-relevant event you emit should answer those. If a log line can’t tell you the actor or the outcome, it’s noise for this purpose. A web access log that records the path but not the authenticated user forces you to join it against session tables you may not have kept, so put the user ID in the access log.

    Time is the join key, so treat it like one

    Investigations are mostly timeline building, and a timeline is only as good as its clocks. Three rules have saved me hours:

    Log in UTC with an explicit offset, in RFC 3339 format. Local time without an offset turns every daylight saving change into an argument. Keep every host synchronised with NTP (chrony is the sane default on Linux) and alert when a host drifts. And record both the event time and the time the pipeline received it, because the gap between them is how you spot a host that buffered logs for an hour or a clock that jumped.

    A structured event that actually answers the questions looks something like this:

    {
      "ts": "2026-10-13T13:47:12.381Z",
      "ingest_ts": "2026-10-13T13:47:13.020Z",
      "event": "auth.login",
      "outcome": "failure",
      "reason": "bad_password",
      "user": "j.smith",
      "src_ip": "203.0.113.24",
      "user_agent": "Mozilla/5.0 ...",
      "mfa": "none",
      "request_id": "9f2c1e7a-4c1b-4a8e-b0a2-1d5f6c3e8b90",
      "service": "sso"
    }

    The request_id is the field I’d fight hardest for. When the same ID flows through your load balancer, API and database audit logs, you can follow a single request across systems without guessing from timestamps.

    The events that earn their storage

    You can’t log everything forever, so spend the budget on events that show up in nearly every investigation. Authentication, both successes and failures, comes first. Privilege changes (group membership, role assignments, new API keys, sudo) come next. On endpoints and servers, process execution with full command lines is the single most useful source I know of. On Windows that means event 4688 with the “Include command line in process creation events” policy enabled, or Sysmon event ID 1. On Linux, auditd can record execve calls:

    # /etc/audit/rules.d/50-exec.rules
    -a always,exit -F arch=b64 -S execve -F key=exec
    -a always,exit -F arch=b32 -S execve -F key=exec
    -w /etc/sudoers -p wa -k sudoers
    -w /etc/sudoers.d/ -p wa -k sudoers

    Execve logging on a busy build server is loud, so measure the volume before rolling it out everywhere. Config changes to cloud accounts (CloudTrail, Azure activity logs) and data access on your most sensitive stores round out the list.

    Log the logging too. Windows event 1102 means the security log was cleared. A sudden drop in event volume from a host usually means an agent died, a disk filled up, or someone stopped the service on purpose. All three deserve an alert.

    Retention is a decision, so make it on purpose

    Default retention settings were chosen by whoever priced the product, not by your threat model. Mandiant’s M-Trends 2024 report put the global median dwell time at 10 days for 2023, and a median hides a long tail of intrusions discovered months later.

    Log4Shell is the example I keep coming back to. CVE-2021-44228 went public on December 9, 2021, and Cloudflare later reported seeing exploitation attempts as early as December 1. Teams with seven days of searchable logs couldn’t answer the most basic question, which was whether anyone had tried this against them before the disclosure.

    The US federal baseline in OMB memo M-21-31 asks for 12 months of active storage and a further 18 months in cold storage for most log categories. You don’t need to copy that exactly, but it’s a useful reference point when someone suggests 14 days is plenty. A two-tier setup works well: a few months hot and searchable, a year or more in cheap object storage that you can rehydrate when needed.

    The 2023 Storm-0558 intrusion into Microsoft-hosted email made the cost of missing logs very public. The US State Department spotted it because it had access to the MailItemsAccessed audit event, which at the time came with a premium licence tier. Many other affected organisations didn’t have that event at all. Microsoft later expanded default logging, but the point stands: find out which audit events your SaaS providers keep behind a paywall before you need them.

    Make the logs outlive the attacker

    Local logs are a convenience. An attacker with root can edit them, so on their own they aren’t evidence. Ship events off the host within seconds, to a system that the host’s own credentials can’t modify or delete. For the archive tier, write-once storage such as S3 Object Lock removes the “delete the evidence” option entirely, including for a compromised admin account if you use compliance mode.

    Keep the pipeline’s buffering in mind too. A forwarder with a small in-memory queue will drop events during exactly the network trouble an incident tends to cause. A disk-backed queue costs very little.

    Things you should not be logging

    Secrets, session tokens and passwords should never land in a log. The classic leak is a failed login where the user typed their password into the username field, so be careful about logging submitted usernames verbatim on failure paths. Bearer tokens in URLs end up in access logs and proxy logs, which is one more reason to keep them in headers.

    Log4Shell also taught a second lesson: the logger itself parses what you hand it. Treat attacker-controlled strings as data, keep logging libraries patched, and prefer structured fields over string interpolation.

    Test it before you need it

    Pick an incident from your own history, or a public one, and try to rebuild its timeline using only what your logging pipeline holds today. Time yourself. Every question you can’t answer, or that takes an hour of joining CSV exports, is a concrete gap with a concrete fix. Repeat it every quarter, since logging coverage quietly decays as services get added.

    The next part of this series turns these events into detections that are written, reviewed and tested like code.

    Other parts: Part 2: Writing detections as code: Sigma rules tested against real logs. Part 3: Alert fatigue: tuning detections without going blind.