
Category: Software Engineering

  • Big-O in Practice: Why Your Database Query Planner Thinks Differently Than You

    Big-O in Practice: Why Your Database Query Planner Thinks Differently Than You

    The gap between asymptotic analysis and real execution
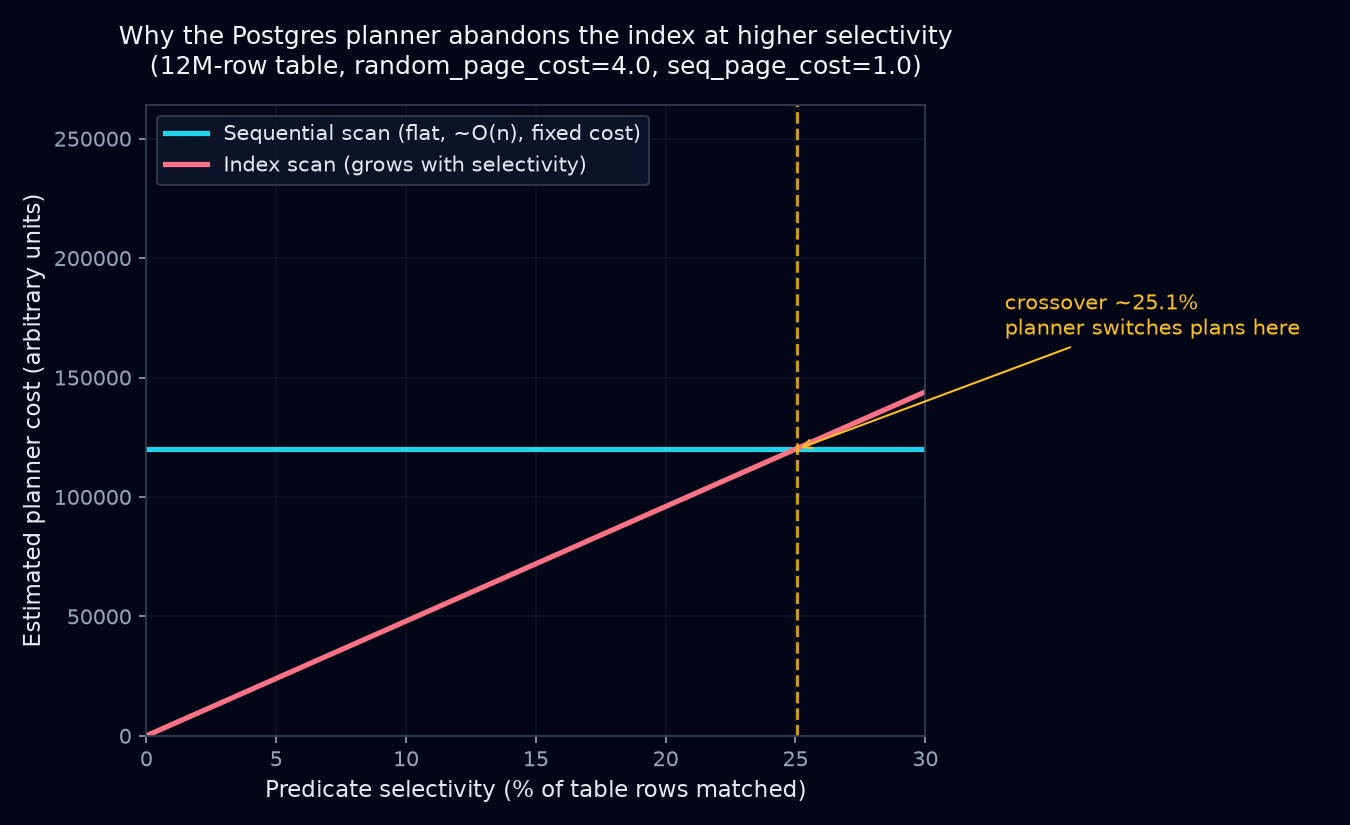
    Chart showing Postgres planner cost crossover between sequential and index scans

    Big-O tells you how a cost grows as input grows, in the limit, with constants thrown away. That’s the right tool for comparing two sorting algorithms in a CS class. It’s the wrong tool, on its own, for predicting how a database executes a query. A query planner isn’t picking between abstract algorithms on an idealized machine. It’s picking between concrete physical operations (sequential reads, random reads, hash builds, sort buffers) against a measured data distribution, and it prices them in estimated page fetches and CPU cycles, not big-O classes.

    A B-tree lookup is O(log n). A full table scan is O(n). If you stopped there you’d expect the planner to grab the index every time n gets large. Real planners routinely do the opposite, and they’re right to.

    Index scan vs. sequential scan

    An index scan traverses the B-tree, which is cheap (a handful of comparisons), then for each matching entry fetches the corresponding heap page to get the actual row. That’s a heap fetch, and unless the index is covering, you pay for one per match. Each heap fetch is potentially a random I/O: a different disk page, no locality guarantee, unless the table happens to be physically clustered on that column.

    A sequential scan reads the table page by page in physical order. On spinning disks, and even on SSDs behind a page cache, that order benefits from read-ahead and prefetching, which makes it dramatically cheaper per page than scattered random access.

    So the comparison isn’t O(log n) vs O(n). It’s closer to this:

    index_scan_cost ≈ log(n) [tree traversal]
                     + selectivity * n * random_page_cost  [heap fetches]
    
    seq_scan_cost   ≈ n * seq_page_cost

    Postgres defaults random_page_cost to 4.0 against a seq_page_cost of 1.0 (people tune it down to around 1.1–1.5 on SSD-backed systems, but it’s still at or above sequential cost). Selectivity is the fraction of rows the predicate is expected to match. Once that fraction gets large enough, the selectivity * n * random_page_cost term outgrows the cost of just reading the whole table in one pass. The crossover usually shows up in the single-digit percentages of the table, not some rare edge case. That’s why an index that’s fantastic for a highly selective predicate turns actively harmful for a low-selectivity one, and the planner refusing to use it is the correct call, not a bug.

    The planner doesn’t know Big-O. It knows statistics.

    Postgres’s planner is cost-based. It never reasons “index lookup is logarithmic.” It pulls numbers from pg_statistic, populated by ANALYZE: table row count (reltuples), most-common values and their frequencies, histogram bounds for everything else, and correlation between physical row order and column value. From that it computes an estimated selectivity for your predicate, feeds it into the cost formulas above (plus startup cost, CPU tuple cost, CPU operator cost), and picks whichever plan comes out cheapest.

    Big-O describes a trend as n approaches infinity. The planner cares about one specific n, one specific selectivity, and specific hardware cost ratios, and it has to estimate all of that. When stats are stale or a predicate correlates with something the optimizer doesn’t model, those estimates can be badly wrong.

    An illustrative example (not captured live, representative of real behavior)

    Table: orders, 12 million rows, B-tree index on status.

    CREATE INDEX idx_orders_status ON orders(status);
    ANALYZE orders;

    Querying a common status:

    EXPLAIN ANALYZE
    SELECT * FROM orders WHERE status = 'pending';
    Seq Scan on orders  (cost=0.00..305412.00 rows=4812000 width=96)
                         (actual time=0.019..1847.332 rows=4798213 loops=1)
      Filter: (status = 'pending'::text)
      Rows Removed by Filter: 7201787
    Planning Time: 0.112 ms
    Execution Time: 1958.410 ms

    ‘pending’ covers roughly 40% of the table. Even with idx_orders_status sitting right there, the planner skips it and does a full scan. That’s correct: fetching 4.8M heap pages randomly through the index would cost far more than one sequential pass, even though the index path is “O(log n) + k” and the seq scan is “O(n).” The constant on the random-access term swamps the asymptotic advantage.

    Now a selective status:

    EXPLAIN ANALYZE
    SELECT * FROM orders WHERE status = 'chargeback_disputed';
    Index Scan using idx_orders_status on orders
                (cost=0.43..892.17 rows=214 width=96)
                (actual time=0.038..0.291 rows=211 loops=1)
      Index Cond: (status = 'chargeback_disputed'::text)
    Planning Time: 0.098 ms
    Execution Time: 0.324 ms

    Selectivity here is about 0.0018%. The heap-fetch term is negligible, and the index wins by roughly four orders of magnitude in wall-clock time, matching the intuitive big-O expectation, because at this selectivity the random-access constant never gets a chance to dominate.

    Same table, same index, same schema. Only the data distribution behind the predicate changed, and you can’t see that by studying the index structure on its own.

    What to do with this

    Indexes aren’t unreliable and seq scans aren’t secretly fast. Complexity class just isn’t enough to predict real execution cost. Four habits follow from that.

    Run EXPLAIN (ANALYZE, BUFFERS) before arguing about a plan from intuition. ANALYZE without BUFFERS only shows estimated vs. actual rows and time. BUFFERS shows actual page hits and reads, which is where you’ll catch cases where estimated and actual plans diverge because the stats are stale.

    Keep ANALYZE current. Autovacuum handles this most of the time, but bulk loads and fast-churning tables can outrun it, and a bad selectivity estimate produces a bad plan no matter how well you designed the index.

    Don’t assume “it has an index, so it’ll use it.” If a predicate commonly matches a large chunk of the table, a partial index (WHERE status != 'pending') or a different approach entirely (a covering index, BRIN for correlated columns, partitioning by status), is usually the real fix. Forcing index usage with planner hints only treats the symptom.

    When you’re comparing two query shapes, compare their actual costs on your actual data, not their theoretical complexity class. A nested loop join, asymptotically worse at O(n*m), can still beat a hash join on small, highly selective inner relations, because the hash build’s fixed overhead dominates at small n.

    Big-O tells you how a cost scales. The planner has to work out what the cost is for this table, this data and this hardware, and so do you when you’re reading its output. I trust the EXPLAIN output over my asymptotic intuition, because the planner is using a cost function I haven’t memorized and statistics I’ve probably never looked at.

  • Threat modeling with STRIDE for a small team

    Threat modeling with STRIDE for a small team

    Most small teams I talk to think threat modeling is something big companies do with a dedicated security architect, a two-week engagement and a 40-page document nobody reads afterwards. That version exists, and it’s mostly a waste. The version that works for a team of five engineers fits in a 90-minute meeting around a whiteboard and ends with a handful of tickets. STRIDE is the tool I reach for because it gives a room full of people a structured way to ask “what could go wrong here?” without needing a security specialist to lead every question.

    What STRIDE actually is

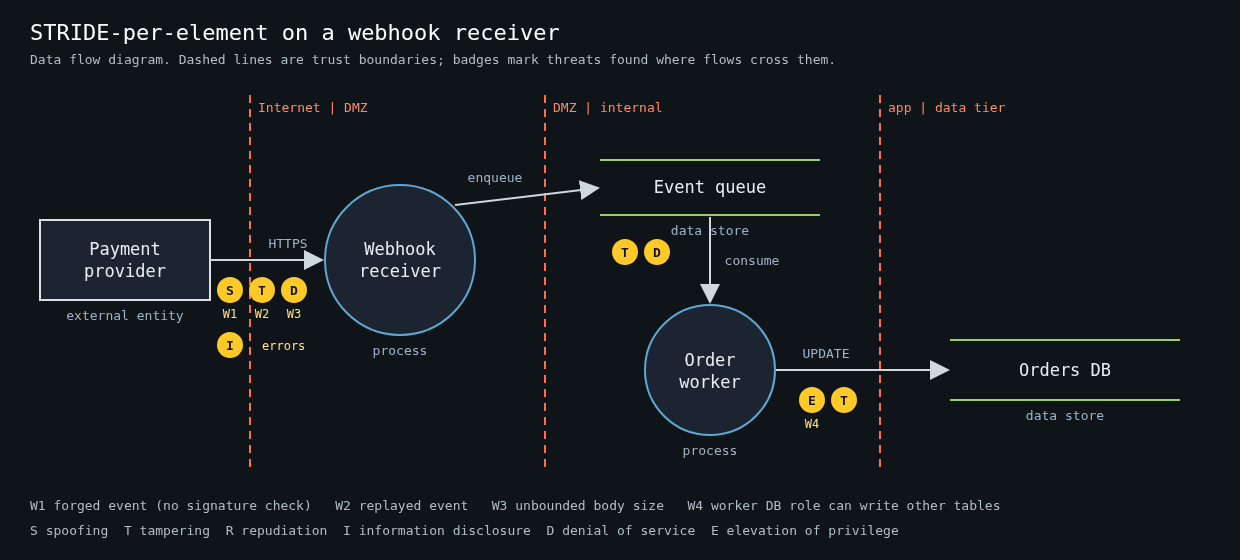
    Data flow diagram of a payment webhook receiver with three trust boundaries and STRIDE threat badges on each boundary-crossing flow

    STRIDE came out of Microsoft in 1999, from Loren Kohnfelder and Praerit Garg, and was popularised by Adam Shostack’s book Threat Modeling: Designing for Security. It’s a mnemonic for six threat categories, each one the violation of a property you want your system to have:

    • Spoofing violates authentication. Someone claims to be a user, a service or a host they aren’t.
    • Tampering violates integrity. Data in transit, at rest or in memory gets modified.
    • Repudiation violates non-repudiation. Someone does something and you can’t prove it.
    • Information disclosure violates confidentiality.
    • Denial of service violates availability.
    • Elevation of privilege violates authorization. A user or component gets capabilities it shouldn’t have.

    That’s it. It isn’t a methodology on its own, and it doesn’t rank anything. It’s a checklist of question shapes. The value is that it stops the discussion from collapsing into whatever the loudest person in the room worried about last week, which in my experience is usually SQL injection.

    Start from four questions, not from the acronym

    Shostack frames the whole exercise as four questions, and the Threat Modeling Manifesto (2020) kept them:

    1. What are we working on?
    2. What can go wrong?
    3. What are we going to do about it?
    4. Did we do a good enough job?

    STRIDE only answers question two. Teams that skip question one end up applying STRIDE to a vague mental picture of “the system”, which produces vague threats like “an attacker could spoof a user”. True, useless.

    So answer question one concretely. Pick one feature or one change, not the whole platform. “We’re adding a webhook receiver that accepts events from our payment provider and updates order status” is a good scope. “Our backend” is not.

    Draw a data flow diagram with trust boundaries

    The diagram is where most of the value comes from, and it should take 15 to 20 minutes. You need four kinds of things:

    • External entities: users, third-party services, anything you don’t control.
    • Processes: your services, workers, lambdas.
    • Data stores: databases, queues, buckets, caches.
    • Data flows: arrows between them, labelled with what moves and over what protocol.

    Then draw trust boundaries, the dashed lines where the level of trust changes. Internet to your load balancer. Your API to the database. Your worker to the third-party API. Your app to the admin interface. If a flow crosses a dashed line, that’s where you spend your time. Flows entirely inside one trust zone rarely produce interesting threats.

    For the webhook example, the boundaries are the payment provider to your public endpoint, your receiver to the queue, and the worker to the orders database. Three crossings. That’s a manageable meeting.

    Walk STRIDE per element

    The variant that works best for small teams is STRIDE-per-element. Not every category applies to every kind of element, and the classic mapping keeps the discussion short:

    • External entities: spoofing and repudiation.
    • Processes: all six.
    • Data stores: tampering, information disclosure, denial of service, and repudiation if the store is a log.
    • Data flows: tampering, information disclosure, denial of service.

    Go element by element along the flows that cross a boundary and ask each applicable question out loud. For the webhook receiver it might go like this:

    • Spoofing: can anyone on the internet POST a fake “payment succeeded” event? Do we verify the provider’s signature, and do we compare it in constant time?
    • Tampering: can a valid event be replayed? Is there a timestamp in the signed payload, and do we reject old ones?
    • Repudiation: if an order flips to paid by mistake, can we show which event did it and where it came from?
    • Information disclosure: do our error responses leak stack traces or internal hostnames to the caller?
    • Denial of service: what happens if someone sends 10,000 large bodies a second? Is there a size limit before we parse JSON?
    • Elevation of privilege: does the worker’s database role need to write to anything except the orders table?

    Every one of those is a concrete, testable question, and most of them are a few lines of code to fix.

    Record threats as tickets, not as a document

    The output of the session is a list of threats, each with a decision. Mitigate, accept, transfer or eliminate the feature. I like a plain table in the repo next to the code, because it gets reviewed in pull requests and it ages with the system:

    | ID | Element            | STRIDE | Threat                                  | Decision  | Ticket   |
    |----|--------------------|--------|-----------------------------------------|-----------|----------|
    | W1 | Webhook endpoint   | S      | Forged event without valid signature    | Mitigate  | PAY-412  |
    | W2 | Webhook endpoint   | T      | Replay of a captured valid event        | Mitigate  | PAY-413  |
    | W3 | Receiver -> queue  | D      | Unbounded body size exhausts memory     | Mitigate  | PAY-414  |
    | W4 | Worker DB role     | E      | Role can write to users table           | Mitigate  | PAY-415  |
    | W5 | Provider outage    | D      | Events delayed for hours                | Accept    | -        |

    Accepted risks are fine. Write down who accepted them. A threat model where everything is “mitigate” usually means nobody was honest about the effort.

    Making it stick on a small team

    Teams rarely fail by modeling badly. They model once at a kickoff and never again, and a few habits help prevent that.

    Tie it to design review. If a change adds a new trust boundary crossing, a new external entity or a new data store with sensitive data, it gets a STRIDE pass. Everything else doesn’t. That keeps it rare enough that people don’t resent it.

    Rotate who facilitates. The facilitator’s job is to keep the group moving through the elements and to stop the session from becoming a design argument. Any engineer can do that after watching it twice, and the person who facilitates tends to start thinking this way in code review too.

    Keep the diagram in the repo as text. A diagram drawn in a SaaS whiteboard is dead the day the meeting ends. Mermaid, PlantUML or OWASP Threat Dragon’s JSON files all diff fine. Microsoft’s Threat Modeling Tool is also free if your team is on Windows and wants STRIDE suggestions generated from the diagram, though I find the generated list too long for a small team to triage.

    Revisit question four. A month after the feature ships, spend ten minutes asking whether any incident, bug report or pentest finding touched an element you modeled. If one did and the model missed it, that’s the most useful feedback you’ll get about your process.

    Where STRIDE falls short

    STRIDE is good at technical threats along data flows. It’s weak on abuse of legitimate functionality, like a referral program being farmed, and on privacy harms, where LINDDUN is a better fit. It also says nothing about likelihood. When a session produces more threats than you can fix, rank them by what an attacker can reach from outside your trust boundaries first, and by what you’d have to explain in an incident report second. That’s crude, and it’s still better than ranking by gut feeling about which bug sounds scariest.

    I’ve watched a five-person team find a missing webhook signature check, an admin endpoint reachable from the public load balancer and a worker with database superuser rights, all in one 90-minute session. Nobody in the room was a security specialist; they drew the thing and asked the questions in order.

  • Horcrux dev log 5: auditing my own project, and what turned out to be fake

    Horcrux dev log 5: auditing my own project, and what turned out to be fake

    Part 5 in the Horcrux dev log series.

    Backdated: written in November 2026 from the repo, CI and my QA ledger. Part 4 ended with a feature list I didn’t trust.

    On October 16 I compared Horcrux against Proxmox VE. I listed every route in the router (418 .route( calls), listed every route the UI calls, matched the two with a script, and then checked whether anything actually calls each feature’s code. The output was a document with a section called “what is fake today”.

    The first results were bad. VMs couldn’t install an OS or get a network: the QEMU command line was memory, CPUs, one disk and -display none, with no ISO, no NIC, no boot order, no UEFI and no way to edit a VM after creating it. Nothing created a QMP socket, so snapshots, migration health checks and “suspend” backups quietly did nothing. Backups tarred a directory the code itself had just created empty and never touched the VM disk. And all configuration lived in memory, so storage pools, firewall rules, HA groups, templates, alert rules, replication jobs and backup jobs vanished on restart.

    The QA ledger from the same day has more. Firewall Apply installed no rules at all (the builder emitted tcp tcp dport, and the UI posted to a route that didn’t exist). Directory storage pools reported 0 GB free, so every volume create failed. VM consoles didn’t work since QEMU ran with no display and no VNC or SPICE listener. Several UI buttons had no handler: monitoring “Configure Alerts” and “Export Data”, NAS “Create Group”, the user edit icon.

    The worst entry is marked critical. /api/auth/register was public and the RBAC middleware was never applied, so any self-registered account had full control, and the API ran over plain HTTP.

    Finding that a week after calling it feature complete was painful. The ledger got 44 new rows on the 16th and 39 on the 17th.

    The fixing week

    Forgejo for October 16 to 21: 348 runs, 208 success, 44 failure, 34 cancelled, 62 skipped, over about 170 commits. Everything in memory moved into the database with migrations. VM backups became real (QMP pause or snapshot, flushed disks, restore, retention, verify). VNC, SPICE with audio, clipboard and USB redirection, and serial consoles got wired up, plus in-browser consoles for LXD and Incus. Auth got rewritten: users, roles, groups, ACLs, LDAP/AD/OIDC/PAM realms, 2FA, RBAC on every route, HTTPS by default, and a test that runs every built-in role against every route. VMs got NICs, an ISO library, boot order, multiple disks, UEFI, edit, reboot and a per-VM firewall. Peer-to-peer migration between nodes works now.

    What a real run caught

    On the 17th a test caught this one, which I’ll quote:

    QEMU adds a default user-mode (SLIRP) e1000 NIC when no -nic/-netdev is
    given. It NATs the guest through the host's own network stack, so on an
    EC2 host a guest read the host's instance metadata (CirrOS printed the
    host's instance-id) and could fetch its IAM role credentials.

    The fix always passes an explicit no-NIC option, and a test boots a real VM and asks QEMU over QMP that it has none.

    Same class of bug, over the next few days: disk import followed qcow2 external data files and read other files on the host (Oct 19). URL downloads for disks and ISOs could reach the node’s own services (Oct 19 and 20). Volume names could escape their storage pool by path traversal (Oct 20).

    Mutation testing

    I also added cargo-mutants runs per module group. The first storage measurement was awful. The commit says it flatly: “StorageManager – mutation baseline was 0%”. Killing survivors became routine; 17 surviving mutants in the VM snapshot code was one batch. I also split the giant API binary into crates on the 17th (core, nas, k8s, sdn, auth, vm, container, cluster, backup), with CI moving to mold and line-tables-only builds the same day.

    Still broken on the 21st

    Some features existed in the API and not the UI, or the reverse. The cluster code had been tested with containers as nodes, not on separate real machines, as far as I can tell from the CI. On the 21st I rewrote the status line to “in active development, not yet suitable for production use” and cut the stale ones.

    Decisions

    No implicit NIC: a VM with no network configuration gets no network at all rather than QEMU’s default user-mode one, because that default NATs through the host and a guest reached the host’s cloud metadata service. URL downloads got the same rule (they can’t reach the node’s own services or metadata). HTTPS by default with a node-local CA came in with the auth rewrite.

    Snapshot-mode backups don’t pause a running VM. On the 16th it paused (QMP stop and cont); on the 19th the commit “backs up a running VM without pausing it” made it a block-level snapshot. The earlier QA entry says why: consistent but not pause-free, and Proxmox-style backup needs a copy-before-write job.

    One decision about the test jobs is on record: on October 18 mutation and chaos jobs went back to every runner, because the colo-only lane’s backlog was too big.

    Other parts: Part 1, Part 2, Part 3, Part 4, Part 6. The series continues with the latest Horcrux dev log post.